The Sock category for many retailers has often been referred to as the silent giant — quietly driving apparel sales and providing a stable source of revenue for retailers.
Despite a 14 percent drop in unit sales year-to-date (YTD) according to analysis of retail point-of-sale data compiled by SSI Data* powered by SportsOneSource, the Sock category was the third largest in unit sales and the fifth largest in the Apparel category in dollar sales.
Sock sales accounted for 9 percent of total Apparel dollar sales and 18 percent of unit sales in 2015, and accounts for roughly 10 percent of Apparel dollar sales within Chain Specialty and Athletic Specialty/Sporting Goods stores.
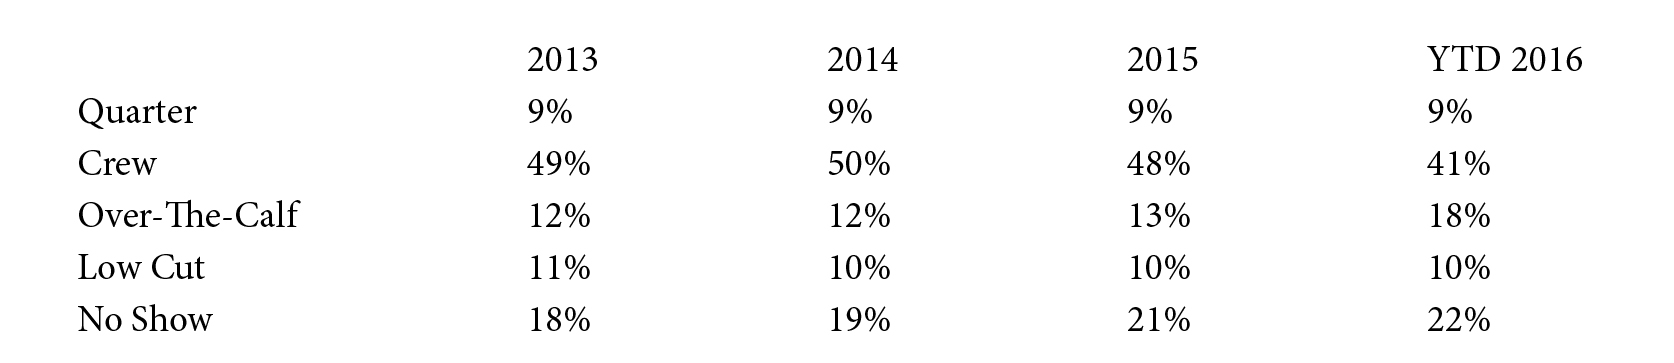
In 2015 the Crew sock consumer slowly gravitated toward Over-The-Calf socks. The trend picked up significant momentum in 2016 as Crew socks dipped 7 percent in unit share while Over-The-Calf socks gained an additional 5 percent of the market.
Sock Unit Share By Sub-Category
The growth in Over-The-Calf socks has been especially significant in Licensed Apparel; which gained 23 percent in YTD dollar sales. Licensed sock sales for the National Basketball Association (NBA) skyrocketed 71 percent YTD with all-but-a-handful of teams having had significant growth.
• The Golden State Warriors were up 419 percent and were the top-selling team YTD overtaking 2015 top seller Cleveland Cavaliers (+92 percent).
• The Oklahoma City Thunder gained 1,310 percent to become the No. 3 franchisee in Licensed Apparel|Socks.
With all three of the teams playing in their respective conference championships, coupled with an emerging trend towards Over-The-Calf socks, retailers of NBA Licensed socks should continue to see banner sales.
*SSI Data, powered by SportsOneSource, collects and analyzes POS data from more than 20,000 retail doors across nine channels of distribution. To learn more contact Ben Pickel, Sports & Fitness Category Manager, SSI Data | SportsOneSource at 303.997.7302 or email bpickel@sportsonesource.com.
Photo courtesy Nike