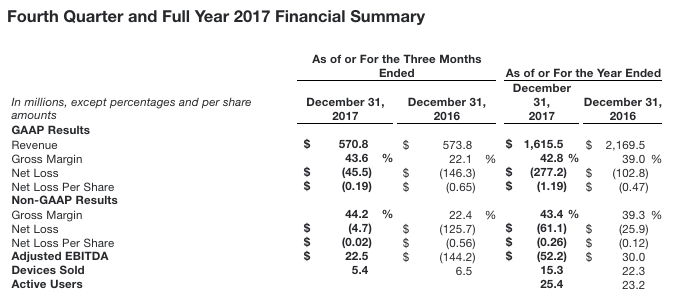
Fitbit Inc. reported a non-GAPP loss of $5 million, or 2 cents a share, in the fourth quarter, worse than Wall Street’s consensus estimate of break-even results.
Sales reached $570.8 million, slightly down from $573.8 million a year ago and missing Wall Street’s average target of $589 million.
The GAAP net loss per share was 19 cents a share, GAAP net loss was $46 million, cash flow from operations of $52 million and free cash flow of $25 million, for its fourth quarter of 2017.
For the full-year 2017, Fitbit reported revenue of $1.6 billion, GAAP net loss per share of $(1.19), non-GAAP net loss per share of $(0.26), GAAP net loss of $(277) million, non-GAAP net loss of $(61) million, cash flow from operations of $61 million and free cash flow of $(25) million.
“We made important progress in 2017 under rapidly changing market conditions. We delivered on our full year guidance and drove down operating expenses while continuing to invest in innovation. We delivered important foundational assets with the launch of the Fitbit operating system and SDK, allowing us to scale future smartwatches quickly and deliver dynamic experiences for users. We also made progress in integrating into the healthcare system, with strategic collaborations with United Healthcare and Dexcom and acceptance into the FDA’s digital health pre-certification program,” said James Park, co-founder and CEO. “In 2018 we’ll focus on managing down expenses, continuing to expand in the smartwatch category and supporting our engaged global community on their health and fitness journeys.”
Fourth Quarter 2017 Financial Highlights
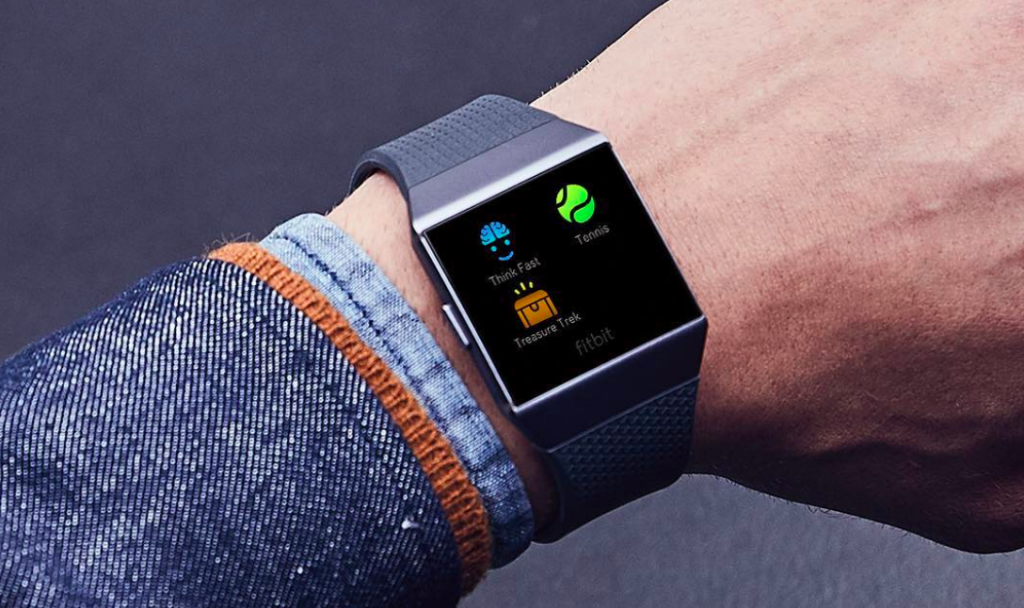
- Sold 5.4 million wearable devices. Average selling price increased 20 percent to $102 per device driven by adding Fitbit IonicTM, our smartwatch, to device mix.
- APAC grew 56 percent to $39 million, Other America’s revenue grew 40 percent to $47 million, EMEA revenue grew 16 percent to $155 million and U.S. revenue decreased 13 percent to $330 million.
- International revenue was $241 million, representing 42 percent of revenue.
- New devices Fitbit IonicTM, Alta HRTM and Fitbit Aria 2TM and accessory Fitbit Flyer, represented 36 percent of revenue.
- GAAP gross margin was 43.6 percent, and non-GAAP gross margin was 44.2 percent.
- GAAP operating expenses represented 46.8 percent of revenue, and non-GAAP operating expenses represented 42.8 percent of revenue.
Full-Year 2017 Financial Highlights
- Sold 15.3 million wearable devices. Average selling price increased 8 percent to $101 per device driven by device mix.
- 37 percent of all activations came from repeat customers; of the repeat customers, 41 percent came from customers who were inactive during a prior period.
- EMEA revenue grew 13 percent to $440 million, Other Americas revenue grew 6 percent to $116 million, APAC revenue decreased 12 percent to $115 million and U.S. revenue decreased 39 percent to $944 million.
- U.S. comprised 59 percent of revenue; EMEA 27 percent, APAC 7 percent and Other Americas 7 percent. International revenue was $671 million, or 42 percent of total revenue, up 7 percent.
- Revenue from Fitbit.com grew 11 percent to $168 million, representing 10 percent of revenue.
- New devices Fitbit IonicTM, Alta HRTM and Fitbit Aria 2TM and accessory Fitbit Flyer, represented 31 percent of revenue.
- GAAP gross margin was 42.8 percent and non-GAAP gross margin was 43.4 percent. Non-GAAP gross margin improved 410 basis points year over year. GAAP and non-GAAP operating expense both declined 7 percent.
- Cash, cash equivalents and marketable securities totaled $679 million as compared with $706 million as of December 31, 2016.
Full-Year 2017 Operational Highlights
- Active users grew 9 percent to 25.4 million from 23.2 million as of December 31, 2016; one of the largest social fitness network as of December 31, 2017.
- Charge 2 was the #1 selling connected health & fitness tracker in the U.S. as of the end of Q4 2017, based on units, according to NPD and each of the products launched in 2017 have a four-star rating on Amazon.
- Headcount totaled 1,749 employees as of December 31, 2017, with 58 percent of employees in research and development. 400 employees were located outside of the United States.
- In Fitbit Health Solutions, added key partnerships: selected as the first wearable device to be used in the National Institute of Health “All of US” precision medicine research program; selected by United Healthcare and Dexcom as the wearable device provider for their Type 2 diabetes pilot program; chosen to participate in the FDA’s new digital health software precertification pilot program; selected by BlueCross BlueShield of South Carolina’s Medicare Advantage plan; chosen by United Healthcare’s Motion program.
First Quarter 2018 Guidance
- Fitbit expects limited revenue from new product introduction. With consumer demand shifting towards smartwatches, they expect revenue to decline approximately (20 percent) to (15 percent) year over year and to be in a range of $240 million to $255 million.
- Non-GAAP basic net loss per share in the range of ($0.21) to ($0.18).
- Capital expenditures as a percentage of revenue of approximately 8 percent.
- They expect free cash flow to decline less than revenue, as receivables turn into cash receipts and less overhead is required to support the growth in inventory, and anticipate free cash flow of approximately $(25) million.
- Effective non-GAAP tax rate of approximately 40 percent.
- Stock-based compensation expense of approximately $26 million and basic share count of approximately 240 million.
Full Year 2018 Guidance
- Fitbit expects their device mix to continue to shift towards smartwatches over the course of the year. They expect to grow Fitbit Health Solutions and increase premium subscribers, but this growth will be relatively immaterial to wearable device revenue. They extrapolated the demand trend forecasted in the first quarter 2018 for the full year and expect revenue to be approximately $1.5 billion.
- They expect device mix shift and fixed cost deleveraging to negatively impact gross margins, partially offset by operating efficiencies.
- They expect to drive operating expenses 7 percent lower, to a target of $740 million.
Capital expenditures as a percentage of revenue of approximately 3.5 percent. - They expect free cash flow to decline less than revenue and expect to breakeven for 2018. Guidance excludes the benefit of an expected $80 million tax refund payment.
- They expect effective non-GAAP tax rate to be volatile driven by geographic mix of revenue, tax credits, and shift to profitability.
- Stock-based compensation expense of approximately $110 million and basic/diluted share count of approximately 248/267 million.
Photo courtesy Fitbit


