By Thomas J. Ryan
<span style="color: #a1a1a1;">While many opportunities have quickly dried up with the spread of the coronavirus pandemic, SFIA’s 2019 State of the Industry Report showed the industry had strong momentum coming into the year, offering some hope that pent-up demand will be there when the industry can relaunch.
Among the encouraging findings:
- The overall industry grew 3.9 percent in 2019, the highest growth rate in 17 years. The 3.9 percent growth was nearly double the 2.3 percent annual GDP. During the prior three years, the sporting goods industry’s growth trailed GDP growth.
- Athleisure, as it has for some time, continued to dominate footwear and apparel and drove sales growth to make up for softer performances in performance categories.
- Two-thirds of the sporting goods industry reported that business was going well, and they continued to have an optimistic outlook for the future. Companies were found to be more aggressively investing in inventories than 2018. Slightly more planned to increase their R&D investments in 2020 when compared to the 2019 projection.
- Inactivity levels decreased for the first time in 10 years led by a continued improving trend in youth age segments 6-to-12 and 13-to-17.
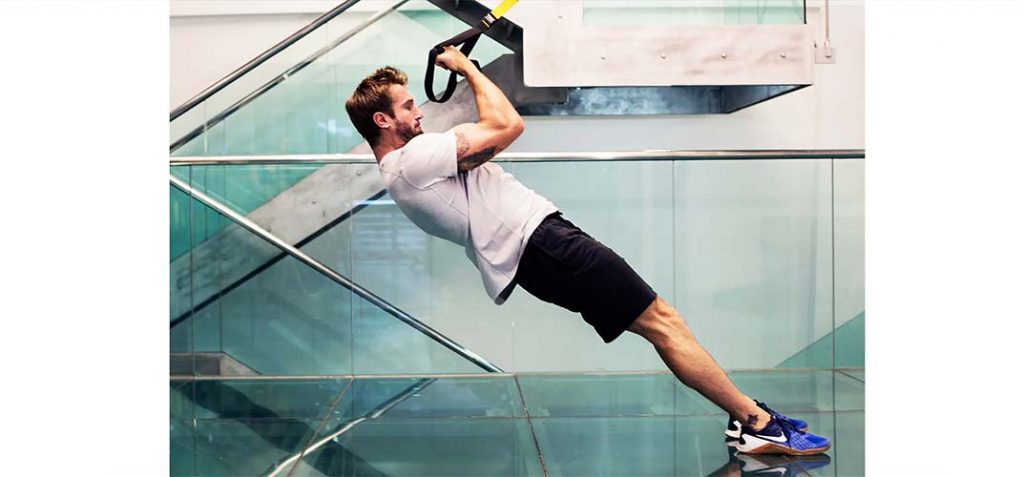
- In fitness, nearly every category increased in participation. The Team sports category, as a whole, also grew as sizeable gains in basketball, outdoor soccer, volleyball, and flag football helped offset declines elsewhere.
One ongoing challenge is households in lower-income brackets that continue to be significantly more inactive than households in higher income brackets. Most of the 3.9 percent industry growth came from the larger leaders while smaller and mid-size brands were found to be still struggling and grinding it out.
“Top brands captured the lion’s share of the growth while secondary brands had to work doubly hard to keep up,” said Tom Cove, president and CEO in the study. “Struggling companies saw little trickle down from overall industry growth.”
…
<span style="color: #a1a1a1;">Overall, profitability in 2019 was slightly down as companies became more retail dependent. Two-thirds of brands that reported more than 40 percent of sales on their own websites showed an increase in profitability. Category leaders did “very well” in terms of profitability while the rest of the industry demonstrated slight increases or decreases. A total of 45.8 percent of companies increased profitability in 2019 while 19.7 percent decreased in profitability.
The report found that significant interest in reducing inventories in 2018 contributed to a promotional retail environment in 2019 but ultimately helped the industry maintain and increase retail prices and be in a better position to promote new products.
A total of 54.1 percent of industry respondents to an accompanying survey said they planned to increase R&D investments in 2020 versus 52.1 percent who said so in 2019, an encouraging sign after the industry had pulled back following the bankruptcies of Sports Authority and other chains. SFIA wrote in the industry report, “Often R&D is one of the first line items to be cut when companies struggle, so when brands invest and plan to increase R&D investments, it typically means that the industry is doing well.”
The survey did find industry participants expected the highest rate of growth in 2020 to come from their own websites with third-party platforms such as Amazon close behind. It also found that while only 10.2 percent of industry respondents to the survey had their own stores, those stores accounted for 40.8 percent of their sales.
Concerns were found to be increasing over product sourcing, material cost/availability and labor cost/availability that directly related to the trade war with China. The survey was done well before the pandemic arrived. The top concern, increasing market share, has been the top concern for the industry every year except 2018.

Inactivity Still Hovering Around A Quarter Of The U.S. Population
For the first time since 2009, the overall inactivity rate dropped to 26.8 percent, a 0.5 percent change. Inactivity rates for all but one age segment (ages 45-to-54) declined. Young adults ages 18-to-24 had the largest decrease. A five-year positive trend in activity of youth ages 6-to-12 and 13-to-17 appears to be benefitting from campaigns from larger sports companies and governing bodies. The 2019 rate of inactivity was still higher than 10 years ago when just a quarter of the population was inactive.
As one million Americans became active during 2019, most chose to participate in high-calorie activities at a casual level, following the shift from core to casual that has been in play since 2014. Overall, over one-third of the population remained active in high-calorie fitness — meaning they participated at least three times per week in a high-calorie burning activity.
Fitness Activities Continued The Gaining Trend
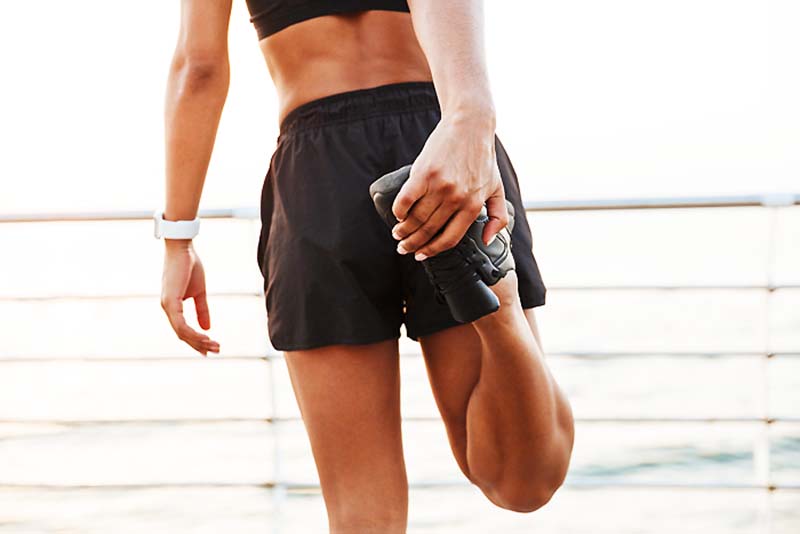
Fitness sports remained the most participated in activities with 67.3 percent of Americans engaged in running, spin class, water aerobics, and the like. This figure was 9.9 percent higher compared to 6 years ago. Nearly every fitness category increased in participation. Dance, step and other choreographed exercise to music (7.0 percent); aquatic exercise (6.4 percent); rowing machine (5.9 percent); treadmill (5.7 percent); and yoga (5 percent) represented the greatest year-over-year growth.
Team sports participation increased 2.5 percent maintaining the upward climb from 2016, although it was more of a mixed bag among activities. Out of 23 team sports, 16 reported a decline in participation; the team sports category as a whole, however, increased in participation. This growth is attributed to increases in select traditional team sports including basketball (2.9 percent), outdoor soccer (4.5 percent), volleyball (2.7 percent), and flag football (3.2 percent).
Outdoor participation continued to gain momentum just at a slower rate. Half of the American population ages 6 and older participated in some form of outdoor activity in 2019; day hiking, trail running and kayaking all had substantial gains.
Other Findings Around Participation:
- Dance, Step, and Other Choreographed Exercise to Music led participation gains among the top-25 sports/activities, with a 0 percent year-over-year gain in 2019. That was followed in the top-five gainers by yoga, up 6.0 percent; treadmill, 5.7 percent; hiking (day), 3.8 percent; and basketball, 3.7 percent. Gains of more than 2 percent were also seen in camping, swimming for fitness, and stair-climbing machine. Among other popular activities, running/jogging saw a 1.2 percent increase in participation and is ahead 1.9 percent on average over the last three years. Road/Paved Surface Bicycling participation was ahead 0.9 percent in 2019. Declining categories in the top-25 categories by participants bowling, bodyweight exercise, wildlife viewing, tennis and table tennis.
- Smaller, niche activities gained the most momentum over the past three years. Only two (hiking and yoga) of the Top 10 fastest growing sports/activities were also in the Top 25 most participated sports/activities;
- Yoga gained significantly, increasing 2.1 percent on average since 2016. The industry found ways to integrate yoga into lifestyles whether it’s yoga at breweries, yoga with animals or community yoga at the park. These creative initiatives attracted Americans looking for an experience;
- Pickleball, another niche sport, has been one of the Top 5 fastest-growing activities for the last five years. This sport’s growth has been stable and consistent. This gain can be attributed to tennis players who could no longer sustain the endurance needed for the game and switched their preferred racquet sport to pickleball; and
- Trail running has only 10 million participants, well below the over 50 million Americans who ran/jogged in 2019, but had the most participation growth in the past three years, 8.6 percent on average. Gaining 6.1 million participants in the last 10 years, trail running continues to surge in popularity.
- The top-25 fastest growing sports/activities since 2017 were trail running, 8.6 percent; pickleball, 7.2 percent; kettlebells, 6.3 percent; rowing machine, 5.8 percent; cardio tennis, 5.7 percent; hiking (day), 5.7 percent; boxing for competition, 5.7 percent; bicycling (bmx), 5.6 percent; yoga, 5.1 percent; kayaking (recreational), 4.4 percent; basketball, 3.7 percent; sledding/saucer riding/snow tubing, 3.6 percent; stationary cycling (group), 3.6 percent; birdwatching more than 1/4 mile from home/vehicle, 3.4 percent; stand up paddling, 3.4 percent; barre, 3.3 percent; football (flag), 3.2 percent; dance, step, and other choreographed exercise to music, 3.2 percent; treadmill, 3.1 percent; fishing (fly), 2.8 percent; fishing (saltwater), 2.5 percent; free weights (barbells), 2.3 percent; baseball, 2.3 percent; camping, 2.1 percent; and surfing, 2.1 percent.
The report also includes an exploration of the impact of increasing tariffs on sourcing decisions as well as interviews with Koichiro Kodama, CEO, Asics North America; Dev Pathik, founder and CEO, Sports Facilities Advisory; and Robbert de Kock, president and CEO, WFSGI.
In 2019, a total of 18,000 online interviews were conducted as part of the study. The results are derived from a combination of aggregated quantitative data that is collected from a sample of the manufacturers in a variety of product categories along with additional industry data collected throughout the year.
The report is free to SFIA members. For more information go here.
Photos courtesy Insider


