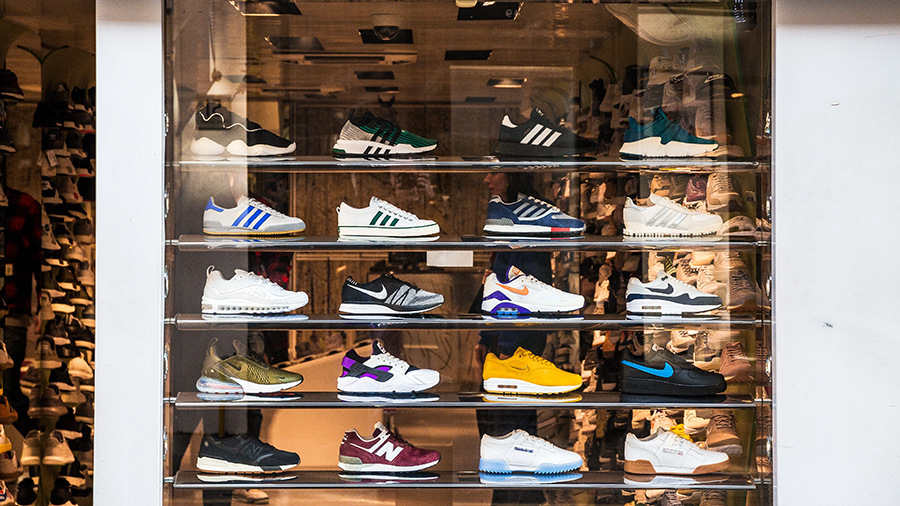
Shoe Carnival, Inc. slightly lowered its outlook for the year as second-quarter earnings and sales missed analysts’ estimates. The family footwear chain said that while overall conditions improved from earlier in 2023, soft traffic results continued within lower-income households and urban markets to lead to a 6.5 percent same-store decline in the quarter.
Earnings in the second quarter came in at 71 cents a share, below Wall Street’s consensus of 84 cents. Sales of $294.6 million were above analysts’s consensus estimate of $290 million. Updated guidance now calls for EPS in the range of $3.10 to $3.25 ($3.60 to $3.85 previously), sales in the range of $1.19 billion to $1.21 billion (1.23 billion to $1.25 billion previously), and gross margin in the range of 36 to 37 percent (unchanged).
Highlights
- Net sales and diluted earnings per share improved from first quarter 2023 as a result of investments in branding, advertising and in-store experience.
- Softness in urban markets led to comparable sales down 6.5 percent versus prior year.
- Shoe Station net sales increased low-single digits in second quarter 2023; growth accelerated in August to mid-teens during back-to-school, both versus prior year.
- Gross profit margin exceeded 35 percent for the 10th consecutive quarter.
- Annual guidance is updated, reflective of second-quarter results and ongoing consumer trends.
“Our second quarter results demonstrated the momentum of our strategy within the context of a challenging economic backdrop. We delivered improvement on net sales, earnings per share and market share growth versus first quarter 2023, while also increasing investment in our branding, advertising and in-store experience. In August, we opened our 400th store and surpassed over half of our stores being modernized,” said Mark Worden, president and chief executive officer.
“We saw improving conditions related to the impact of inflation in the second quarter, but some of our urban customers remain challenged in the current economic environment. As such, we are taking a measured approach to the balance of the year. Given the strength of our balance sheet and our strategy, we are in a strong position to grow as the economy improves and continue to actively evaluate both organic and acquisition-related opportunities,” said Worden.
Second Quarter Operating Results
Net sales were $294.6 million, down 5.7 percent in the quarter compared to second quarter 2022, with comparable store sales down 6.5 percent. While overall conditions improved from earlier in 2023, soft traffic results continued within lower-income households and urban markets, partially offset by 5.4 percent e-commerce net sales growth and growth from the new Shoe Station stores. E-commerce net sales were favorably impacted by the February 2023 launch of shoestation.com and increased net sales through shoecarnival.com. With an improved brand name assortment this year, net sales of athletic merchandise in second quarter 2023 were flat compared to the second quarter 2022 despite lower store traffic.
Gross profit margin was 35.8 percent, down 40 basis points, with merchandise margin down 20 basis points. Buying, distribution and occupancy (“BDO”) costs were lower in the quarter compared to the prior year as freight and distribution costs have continued to decrease, partially offset by investment in store modernization and by rent associated with operating more stores. However, on the lower net sales, BDO decreased gross profit margin by 20 basis points.
Selling, general and administrative expenses (SG&A) were $80.8 million in second quarter 2023, or 27.4 percent of net sales. $6.2 million of the increase in SG&A compared to second quarter 2022 resulted from strategic investments in brand initiatives, advertising and the in-store experience.
The effective tax rate in second quarter 2023 of 22.3 percent was lower than the prior year rate of 25.6 percent. The effective tax rate for the full year is expected to be between 24 and 25 percent compared to 25.2 percent in 2022.
Second quarter 2023 net income was $19.4 million, or 71 cents per diluted share, compared to second quarter 2022 net income of $28.9 million, or $1.04 per diluted share. The EPS in second quarter 2023 improved versus first quarter 2023 by 18.3 percent and is nearly 80 percent higher than any other second quarter in company history prior to 2021.
Merchandise Inventory
Significant progress was made in the first half of 2023 to reduce total inventory and optimize inventory positions for an improved athletic assortment of nationally named brands. Second quarter 2023 ending inventory was approximately $24 million higher than the prior year, comparing favorably to first quarter 2023 when the ending inventory was approximately $44 million higher than the prior year and fiscal 2022 year-end when inventory was $105 million higher than the prior year-end. With back-to-school shopping in progress, inventory is on track to be below prior year levels in September and to achieve the annual guidance for inventory to be approximately $40 million lower by year-end 2023 compared to year-end 2022. Both aged inventory and seasonal carryover inventories are in line, and there is currently no expectation of deep discounting to liquidate merchandise.
Store Count, Modernization and Planned Store Growth
In August 2023, the company opened its 400th store, now operating 373 Shoe Carnival stores and 27 Shoe Station stores. Store productivity and profitability have increased sharply for the fleet since the last time the company operated 400 stores in 2018. The multi-year fleet productivity and rationalization improvement plan contributed to sales per door increasing by more than 15 percent and profit contribution per door increasing by more than 40 percent compared to 2018 levels.
The company is currently modernizing its Shoe Carnival fleet through a multi-year remodel program. As of July 29, 2023, over 50 percent of the modernization initiative was complete, and the company is on track to be approximately 65 percent complete during the summer of 2024.
The company has a strategic growth roadmap in place to surpass 500 stores and be a multi-billion dollar retailer in 2028, inclusive of organic and acquired growth.
Capital Management
The 2022 fiscal year-end marked the 18th consecutive year the company ended a year with no debt, and through year-to-date August, the company continued to fund its operations without debt. As of yesterday, the company had over $90 million of cash, cash equivalents, and marketable securities and approximately $100 million in borrowing capacity. At the end of second quarter 2023, the company had nearly $47 million of cash, cash equivalents and marketable securities and approximately $100 million in borrowing capacity. Cash flow from operations is expected to more than fully fund store remodels and growth planned in the back half of fiscal 2023.
Share Repurchase Program
As of July 29, 2023, the company had $50 million available for future repurchases under its share repurchase program. During second quarter 2023, the company did not repurchase any shares.
Back-to-School Update
Market conditions continued to modestly improve in early third quarter 2023 versus second quarter 2023. August sales and profits were among the highest of any month in the company’s 45-year history, with product margins approaching record highs. The August back-to-school shopping period accounts for half of the company’s third-quarter gross profit, and with the results achieved to date, the company remains on track to deliver its full-year gross profit margin guidance of 36 to 37 percent.
Fiscal 2023 Earnings Outlook
The company now expects to deliver on the following annual guidance for 2023, which includes 53 weeks compared to 52 weeks in 2022:
- Diluted earnings per share (EPS): $3.10 to $3.25
- Net sales (in billions): $1.19 to $1.21
- Gross profit margin: 36 percent to 37 percent
- SG&A (in millions): $321 to $327
- SG&A as a percent of net sales: ~27 percent
- Operating income (in millions): $109 to $116
- Net income (in millions): $85 to $89
- Return on beginning equity: 16 percent to 17 percent
- Cash flows from operations (in millions) $120 to $130
- Capital expenditures (in millions): $55 to $65
- Merchandise inventories (in millions): – ~$40
- Comparable store sales: -8 percent to -6 percent
- New stores: 6 to 10
Photo courtesy Shoe Carnival


