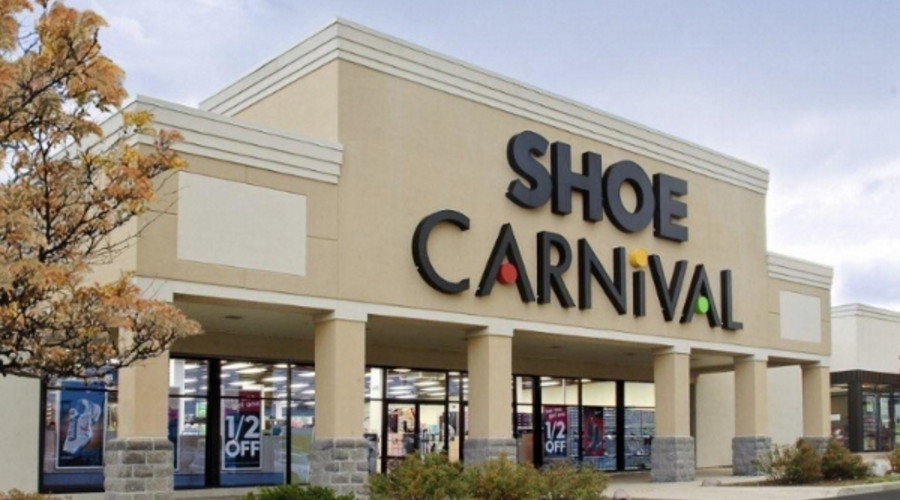
Shoe Carnival Inc. raised its fiscal 2018 outlook after reporting earnings per diluted share increased 15 percent to 76 cents and comparable store sales increased 4.5 percent in the quarter ended November 3.
Third Quarter Highlights
- Earnings per diluted share increased 15 percent to $0.76
- Comparable store sales increased 4.5 percent
- Due to fiscal 2017 being a 53-week year, approximately $25.1 million of net sales reported in the third quarter of 2017 shifted into the second quarter of fiscal 2018, resulting in a net sales decrease of $18.3 million in the third quarter compared to the same period last year
- Repurchased 519,048 shares of common stock at a total cost of $20.0 million under share repurchase program
“We are pleased with our strong third quarter sales results, which reflect growth in all geographic regions and virtually all of our product categories,” commented Cliff Sifford, Shoe Carnival’s president and CEO. “Our third quarter comparable store sales growth of 4.5 percent was on top of a 4.4 percent increase for the same quarter last year. On a year-to-date basis, our comparable store sales have increased 4.2 percent, operating income increased 28.6 percent and earnings per diluted share increased 71.0 percent. As a result of our year-to-date performance and outlook for the remainder of fiscal 2018, we are pleased to raise our annual net sales and earnings guidance.”
Third Quarter Financial Results
Comparable store sales for the thirteen-week period ended November 3, 2018 increased 4.5 percent compared to the thirteen-week period ended November 4, 2017. Primarily due to the calendar shift, net sales in the third quarter ended November 3, 2018 decreased 6.4 percent to $269.2 million, compared to net sales of $287.5 million for the third quarter ended October 28, 2017.
Gross profit margin for the third quarter of fiscal 2018 increased to 30.2 percent compared to 29.8 percent in the third quarter of fiscal 2017. Merchandise margin increased 1.1 percent and buying, distribution and occupancy expenses increased 0.7 percent as a percentage of net sales compared to the third quarter of fiscal 2017.
Selling, general and administrative expenses (“SG&A”) for the third quarter of fiscal 2018 decreased $2.6 million to $65.2 million. The decrease in expense was primarily due to lower advertising expense, expense reductions from closed stores and a gain on insurance proceeds related to stores affected by recent hurricanes, partially offset by an increase in incentive and equity compensation expense as a result of the improved financial performance of the Company. As a percentage of net sales, these expenses increased to 24.3 percent compared to 23.6 percent in the third quarter of fiscal 2017.
Net income for the third quarter of fiscal 2018 increased 12.6 percent to $12.0 million, or $0.76 per diluted share. For the third quarter of fiscal 2017, the Company reported net income of $10.7 million, or $0.66 per diluted share.
Nine Month Financial Results
Comparable store sales for the thirty-nine week period ended November 3, 2018 increased 4.2 percent compared to the thirty-nine week period ended November 4, 2017. Net sales during the nine months ended November 3, 2018 increased $19.1 million to $795.0 million compared to the nine months ended October 28, 2017.
The gross profit margin for the first nine months of fiscal 2018 was 30.5 percent compared to 29.1 percent in the same period last year. SG&A expenses for the first nine months increased $5.5 million to $194.1 million. As a percentage of net sales, these expenses increased to 24.4 percent compared to 24.3 percent in the first nine months of fiscal 2017.
Net earnings for the first nine months of fiscal 2018 increased 61.1 percent to $36.8 million, or $2.36 per diluted share, compared to net earnings of $22.8 million, or $1.38 per diluted share, in the first nine months of fiscal 2017.
Store Openings and Closings
The Company opened three stores and closed nine stores during the first nine months of fiscal 2018 compared to 19 store openings and ten store closings in the first nine months of fiscal 2017. For the full fiscal year 2018, the Company expects to open three stores and close 14 stores compared to opening 19 stores and closing 26 stores during fiscal 2017.
Fiscal 2018 Outlook
The Company is raising its fiscal 2018 outlook as follows:
- Net sales in the range of $1.020 billion to $1.022 billion, with comparable store sales up approximately 3.5 percent;
- Earnings per diluted share in the range of $2.36 to $2.38. Fiscal 2017 earnings per diluted share were $1.15 and adjusted earnings per diluted share were $1.49.
Photo courtesy Shoe Carnival


