
In a May 8 letter to investors, Peloton Interactive President and CEO Peter Stern said the company delivered at the high end of, or exceeded, guidance on its key financial metrics while continuing to execute on FY 2025 operating goals.
“We delivered our fifth consecutive quarter of positive Adjusted EBITDA and Free Cash Flow due to improving hardware unit economics and right-sizing our overall cost structure,” said Stern. Our balance sheet is also deleveraging quickly, which de-risks our business, positions us to invest prudently in sources of future profitable growth, and over time should enable us to reduce our cost of capital,” he shared.
On a personal note, Stern said he recently achieved the Peloton employee “Century Club” milestone, marking 100 days.
“I am even more optimistic about the future of this company and more grateful for this opportunity to lead Peloton than when I started on January 1, said Stern. ” have dedicated my first few months to redefining our purpose and values, learning about this fascinating business and getting to know its mission-driven people, and developing a strategy that can return the company to growth,” he continued.
Stern said Peloton performed above, or at the high-end of guidance on key metrics, including ending paid connected fitness subscriptions, total revenues, total gross margin, and adjusted EBITDA. Operating expenses decreased 23 percent year-over-year, and PTON generated over $90 million of GAAP Net Cash Provided by Operating Activities and non-GAAP Free Cash Flow. Stern said that “member happiness” continues to improve, as measured by the Net Promoter Score (NPS) and Member Satisfaction Scores (MSAT).
“We achieved an NPS above 70 for all our Cardio hardware products and above 80 for the Tread. Member Support MSAT was 4.3 in Q3, reflecting an improvement of 1 percent quarter-over-quarter and 20 percent year-over-year, while Service & Repair MSAT was 4.5, an improvement of 5 percent quarter-over-quarter and 7 percent year-over-year,” Stern shared.
Stern said the company continues making progress on key initiatives, with improved new subscription attach rates from Tread sales year-over-year, increased mix of engagement toward Strength and Meditation, and over a 300 bps increase year-over-year in the mix of men joining Peloton as paid Connected Fitness subscription subscribers.
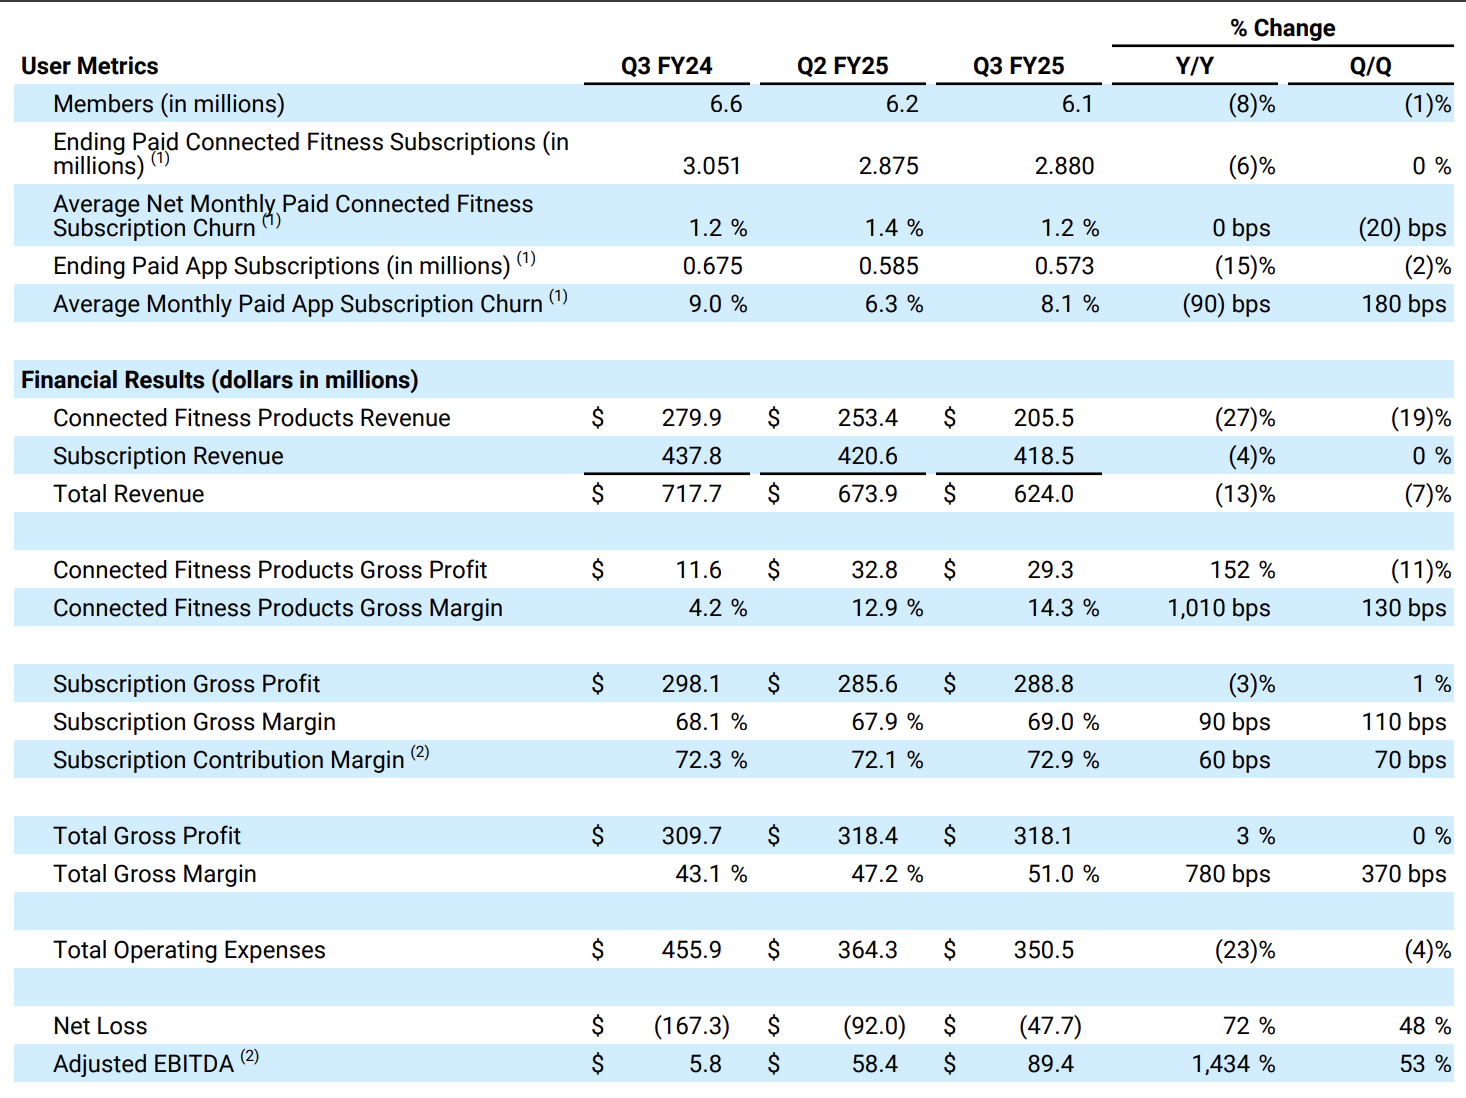
Total Revenue was $624.0 million in Q3, a decrease of $93.7 million or 13 percent year-over-year, comprising $205.5 million of Connected Fitness Products Revenue and $418.5 million of Subscription Revenue. Total Revenue was $9.0 million above the midpoint of the company’s $605 million to $625 million guidance range.
Connected Fitness Products Revenue decreased $74.4 million, or 27 percent year-over-year, driven by lower sales and deliveries across all Connected Fitness Product categories. Seasonally lower hardware sales in Q3 than Q2, reflected in the revenue mix of 33 percent Connected Fitness Products Revenue and 67 percent Subscription Revenue.
Subscription Revenue decreased $19.3 million, or 4 percent year-over-year, driven by lower Paid Connected Fitness Subscriptions and lower Paid App Subscriptions, partly offset by Used Equipment Activation Fee revenue, introduced in Q1 FY25.
“We remain focused on acquiring new members more cost-effectively, and our Q3 performance reflects the continued progress we’ve made in evolving our marketing strategy. Our advertising and marketing spend decreased 46 percent year-over-year, while our Connected Fitness Products Revenue declined by a comparatively lower rate of 27 percent year-over-year,” said Stern. “Our ‘Find Your Power’ marketing campaign, which began in the holiday season, continued in Q3, showcasing the breadth of Peloton’s offerings to men and highlighting our Tread and Strength products. Similar to Q2, this quarter, we saw a 300 bps increase year-over-year in the mix of gross additions to men and improved new subscription attachment rates from Tread sales year-over-year.”
Gross Profit and Margin
Total Gross Profit was $318.1 million in Q3, an increase of $8.4 million or 3 percent year-over-year.
Total Gross Margin was 51.0 percent, an increase of 780 bps year-over-year and 100 bps above company guidance, driven by a revenue mix shift towards its Subscription segment and favorable Connected Fitness Products Gross Margin.
Connected Fitness Products Gross Margin was 14.3 percent, an increase of 1,010 basis points year-over-year, driven by lower inventory write-downs, a mix shift towards higher margin products and lower warehousing and transportation costs, partially offset by changes in PTON’s warranty reserves. Subscription Gross Margin was 69.0 percent, up 90 bps year-over-year.
Operating Expenses
Total operating expenses, including restructuring and impairment expenses, were $350.5 million in Q3, a $105.4 million or 23 percent decrease year-over-year, reflecting the progress the company made thus far toward right-sizing its cost structure. The company continued to track ahead of the cost savings target to achieve at least $200 million of annualized run-rate cost savings by the end of FY25.
Sales and marketing expenses were $106.5 million in Q3, a decrease of $63.8 million or 37 percent year-over-year, primarily from a $51.8 million decrease in advertising and marketing spend and a $3.8 million decrease in personnel-related expenses, inclusive of stock-based compensation.
General and administrative expenses were $151.4 million in Q3, a decrease of $1.6 million or 1 percent year-over-year, driven by a $4.9 million decrease in settlement costs and professional services fees, a $1.9 million decrease in software and IT costs and a $1.8 million decrease in depreciation and amortization costs. These decreases were partly offset by a net increase of $7.0 million in personnel-related expenses, inclusive of stock-based compensation, driven primarily by $21.0 million of executive departure costs, mainly due to the acceleration of stock-based compensation and severance charges under our executive severance plan. Excluding the impact of these executive departures, general and administrative expenses decreased of $22.7 million or 14.8 percent year-over-year.
Research and development expenses were $59.6 million in Q3, a decrease of $17.2 million or 22 percent year-over-year, primarily driven by a $13.1 million decrease in personnel-related expenses, inclusive of stock-based compensation expense and a $2.6 million decrease in product development costs, primarily due to a reduction in contractor expenses.
In Q3 PTON recognized $33.0 million of impairment and restructuring expenses, of which $30.7 million was non-cash. The non-cash charges were primarily asset write-downs related to plans to right-size portions of our corporate office footprint. The cash charges consisted of $2.4 million in severance and other exit and disposal costs as the company continued executing its restructuring efforts.
Net Loss and Adjusted EBITDA
Peloton Interactive’s GAAP Net Loss for fiscal Q3 was $47.7 million, an improvement of $119.6 million year-over-year, and the GAAP Operating Loss was $32.4 million, which was an improvement of $113.8 million year-over-year.
Adjusted EBITDA was $89.4 million in fiscal Q3, a $83.6 million improvement year-over-year and $4.4 million above the high end of the company’s guidance range.
Fiscal 2025 Third Quarter Key Metrics and Results
Balance Sheet and Cash Management Summary
Stern said the company’s balance sheet is deleveraging quickly, with Total Debt decreasing $191.8 million or 11.3 percent year-over-year and Net Debt decreasing $311.6 million or 34.8 percent year-over-year.
“We ended Q3 with $914.3 million in unrestricted cash and cash equivalents, an increase of $85.3 million quarter-over-quarter,” he noted. “We continue to make progress toward deleveraging our balance sheet, as Net Debt reduced $311.6 million or 35 percent year-over-year to $584.9 million. As of Q3, trailing 12-month Adjusted EBITDA of $333.9 million reflects an improvement of $435.4 million year-over-year.”
Outlook
Stern shared that the company was raising the midpoint of its FY25 guidance for key metrics, including ending paid connected fitness subscriptions, total revenue and adjusted EBITDA, while maintaining guidance for total gross margin.
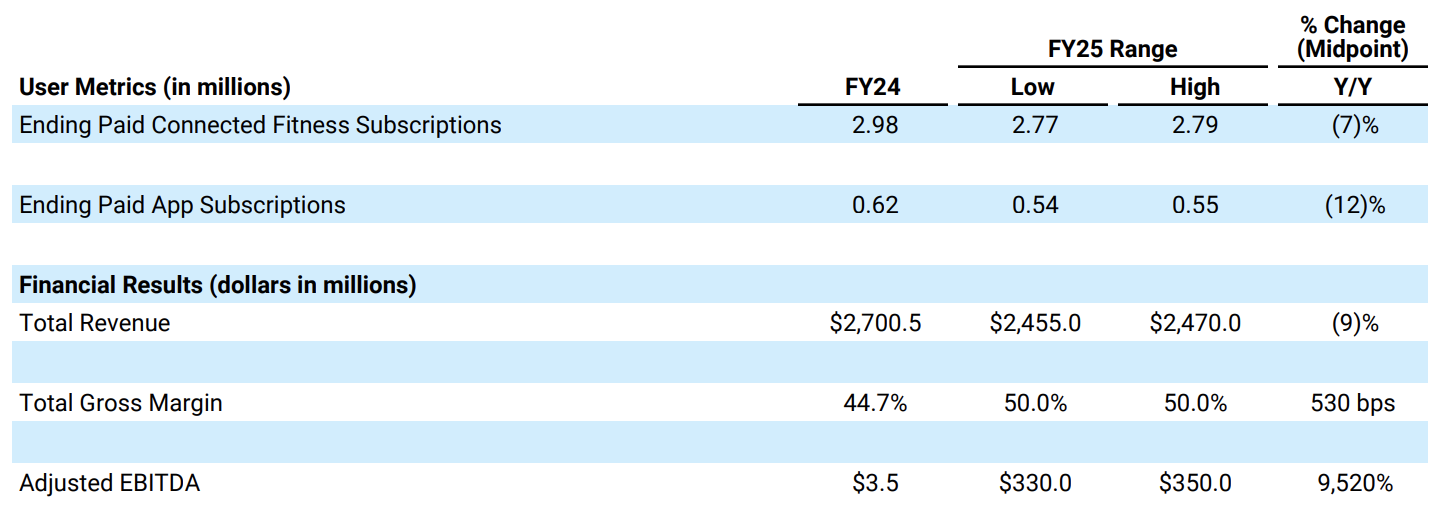
“We are prioritizing these metrics along with delivering free cash flow,” he added. “We are raising our full year FY25 guidance for Ending Paid Connected Fitness Subscriptions to 2.77 to 2.79 million, reflecting a narrower range and an increase of 10,000 at the midpoint. This increase incorporates the outperformance in Q3 and our expectations for seasonally higher net churn in Q4 as we enter the warmer months of Spring and Summer.”
Stern said the FY25 guidance range for ending paid app subscriptions of 540,000 to 550,000 reflects a narrower range and a decline of 30,000 at the midpoint. He added that paid app subscription guidance reflects lower gross additions, primarily due to limiting media spend and investment in attracting new corporate wellness clients.
“We are raising our FY25 guidance for Total Revenue to $2.455 billion to $2.470 billion, reflecting a narrower range and an increase of $7.5 million at the midpoint,” the CEO noted. “This increase incorporates an expectation for favorable Subscription Revenue mainly driven by higher Paid Connected Fitness Subscriptions.
The company’s FY25 outlook for Total Gross Margin of 50.0 percent remains unchanged and incorporates company expectations for minimal impact from tariffs on total gross margin in FY25.
PTON raised its FY25 Adjusted EBITDA guidance to $330 million to $350 million, an increase of $15 million at the midpoint. “Our outlook reflects continued improvements in profitability, largely due to favorability in gross profit and continued operating expense savings,” Stern shared.
Free Cash Flow expectations are said to reflect the impact of tariff policy, which are subject to change. Peloton and Precor-branded equipment are currently subject to a 25 percent tariff on its aluminum content. Precor and Apparel products sourced from China are subject to additional tariffs.
Stern said PTON expects FY25 Free Cash Flow to be near $250 million, which incorporates company expectations for a roughly $5 million Free Cash Flow headwind to Q4 from the impact of tariffs. This meaningful Free Cash Flow generation will continue reducing net debt and deleveraging the company’s balance sheet.
Image courtesy Peloton Interactive