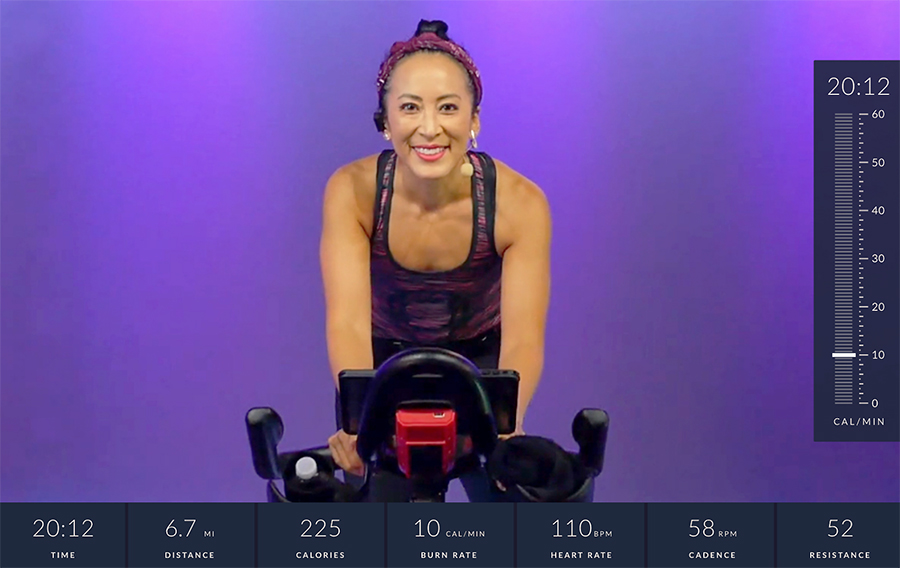
Nautilus, Inc. reported a steep loss in the fiscal first quarter as sales plunged 70.3 percent year-over-year. The fitness company said it achieved the upper end of its revenue guidance and beat its adjusted EBITDA guidance, while direct net sales were up 27 percent versus the pre-pandemic Q120 quarter.
Nautilus also said the total members of JRNY, its digital platform, reached 360,000 with 133 percent year-over-year growth. Nautilus reiterated its full-year guidance.
Management Comments
“We are pleased to deliver solid first quarter results that reflect the execution of our multi-year transformation plan. Our omnichannel approach was critical to our success in the quarter, with Direct channel sales up 27 percent compared to the same pre-pandemic period in fiscal 2020. Further, we continue to expand our digital fitness platform, JRNY, which exceeded 360,000 members at June 30, 2022, representing approximately 133 percent growth versus the same quarter last year,” said Jim Barr, Nautilus, Inc. CEO.
Barr continued, “As we look ahead, we believe we are well-positioned to navigate the current macroeconomic environment. Our ability to offer customers a diversified product assortment of strength and cardio offerings that includes our JRNY platform at a compelling total cost of ownership enables us to drive demand and expand our market position. Based on our performance to date and visibility into the remainder of our fiscal year, I am pleased to reiterate our full-year financial and JRNY member growth guidance. We have made tremendous progress on our North Star strategy, including becoming a nimbler organization that is equipped to adapt to market conditions and continue to deliver against expectations, including our guidance of positive Adjusted EBITDA for the second half of fiscal 2023.”
Total Company Results
For fiscal 2023, Nautilus expects to return to a more typical pre-pandemic seasonality, with the year’s second half contributing more of the full year’s revenue. To gauge sales growth and progress against more “normalized” or pre-pandemic results, the company said it will rely more heavily on measuring the performance of fiscal 2023 sales growth versus the pre-pandemic twelve-month period that ended March 31, 2020 (fiscal 2020) to guide business strategy, rather than measuring performance against the atypical, outsized results that occurred during the pandemic.
Fiscal 2023 First Quarter Ended June 30, 2022 Compared to June 30, 2021
- Net sales were $54.8 million, compared to $184.6 million, a decline of 70.3 percent versus last year. Net sales are up 11 percent, or 3 percent CAGR, compared to the same period in fiscal 2020, excluding sales related to the Octane brand, which sold in October 2020. The sales decline versus last year is driven primarily by the return to pre-pandemic seasonal demand.
- Gross profit was $7.0 million, compared to $55.5 million last year. Gross profit margins were 12.7 percent compared to 30.1 percent last year. The 17.4 ppt decrease in gross margins was primarily due to increased discounting (-8 ppts), unfavorable logistics overhead absorption (-8 ppts), and increased investments in JRNY (-4 ppts), offset by an improvement in other costs (3 ppts).
- Operating expenses were $58.1 million, an increase of $20.5 million, or 54.5 percent, compared to last year, primarily due to a goodwill and intangible impairment charge of $27.0 million and a $3.6 million increase in JRNY investments, partially offset by $5.7 million lower media spending and $2.7 million lower other variable selling and marketing expenses due to decreased sales. Total advertising expenses were $5.1 million versus $10.8 million last year.
- Operating loss was $51.2 million, or a negative 93.4 percent operating margin, compared to operating income of $17.9 million last year, primarily driven by goodwill and an intangible impairment charge of $27.0 million and lower gross profit associated with lower sales demand during the period.
- Loss from continuing operations was $60.2 million, or $(1.92) per diluted share, compared to income of $14.0 million, or $0.43 per diluted share, last year.
- Net loss was $60.2 million, or $(1.92) per diluted share, compared to a net income of $13.9 million, or $0.43 per diluted share, last year.
- The income tax expense was $8.1 million this year compared to $3.4 million last year. This year’s income tax expense was primarily a result of a U.S. deferred tax asset valuation allowance in the amount of $14.2 million recorded this quarter.
The following statements exclude the impact of non-cash impairment charges related to the carrying value of the company’s goodwill and intangible assets for the three months ended June 30, 2022.
- Adjusted operating expenses were $31.2 million, or 56.9 percent of sales, compared to $37.6 million, or 20.4 percent of sales, last year. The decrease was driven by lower advertising and partially offset by JRNY investments.
- Adjusted operating loss was $24.2 million compared to last year’s income of $17.9 million, driven by lower gross profit.
- Adjusted EBITDA loss from continuing operations was $19.9 million compared to income of $21.1 million last year.
JRNY Update
- Nautilus continues to enhance the JRNY platform, including expanding differentiated, visually connected fitness experiences for members.
- As of June 30, 2022, JRNY members, Nautilus’ personalized connected fitness platform, exceeded 360,000, representing approximately 133 percent growth versus the same quarter last year. Of these members, 127,000 were subscribers, representing roughly 290 percent growth over the same period. The company defines JRNY members as persons with a JRNY account and/or subscription, including subscribers, associated users and users who consume free content. It define subscribers as a person or household who paid for a subscription, are in a trial or have requested a “pause”‘ to their subscriptions for up to three months.
- The company has also made strides over the last two years to expand the number of products featuring JRNY connectivity. In FY 2022, approximately 80 percent of total units sold were JRNY compatible, compared to 22 percent in the pre-pandemic FY 2020. The trend of roughly 80 percent of total units sold being JRNY compatible continued in Q1 FY 2023.
- Nautilus’ integration of VAY’s motion-tracking capabilities into JRNY further advances and accelerates personalized strength workout options, including the addition of rep counting and form coaching for SelectTech users, which it believes will drive JRNY membership growth during FY 2023.
Segment Results | Fiscal 2023 First Quarter Ended June 30, 2022 Compared to June 30, 2021
Direct Segment
- Direct segment sales were $26.5 million, compared to $63.4 million, a decline of 58.2 percent versus last year, and up 27 percent, or 8 percent CAGR, compared to the same period in fiscal 2020. The net sales decrease was primarily driven by the return to pre-pandemic seasonal demand and higher sales discounting.
- Cardio sales declined 45.5 percent versus last year and were up 6.5 percent, or 2 percent CAGR, compared to the same period in fiscal 2020. Lower sales were primarily driven by lower bike demand. Strength product sales declined 70.8 percent versus last year and increased 96.7 percent, or 25 percent CAGR, compared to the same period in fiscal 2020. Lower sales this quarter were primarily driven by lower demand for SelectTech® weights.
- The Direct segment ended the quarter with $0.4 million of backlog as of June 30, 2022. These amounts represent unfulfilled consumer orders net of current promotional programs and sales discounts.
- Gross profit margin was 17.2 percent versus 38.7 percent last year. The 21.5 ppt decrease in gross margin was primarily driven by: increased discounting (-8 ppts), unfavorable logistics overhead absorption (-7 ppts) and increased investments in JRNY (-7 ppts). Gross profit was $4.6 million, down 81.4 percent versus last year.
- Segment contribution loss was $9.9 million, or 37.4 percent of sales, compared to segment contribution income of $6.8 million, or 10.7 percent of sales last year. The decline was primarily driven by lower gross profit, as explained above, offset by decreased media spend. Advertising expenses were $5.2 million compared to $8.0 million last year.
Retail Segment
- Retail segment sales were $27.4 million, down by 77.2 percent versus last year. Excluding sales related to Octane, net sales were down 2 percent, or -1 percent CAGR, compared to the same period in fiscal 2020. Retail segment sales outside the United States and Canada were down 83 percent versus last year. The decrease in sales compared to last year is primarily driven by lower cardio sales and higher sales discounting as Retailers work through higher-than-normal inventory levels.
- Cardio sales declined by 86.8 percent versus last year. Excluding sales of the Octane brand, cardio sales were down 28.7 percent, or 11 percent CAGR, compared to the same period in fiscal 2020. Lower sales this quarter were primarily driven by lower bike sales. Strength product sales declined by 48.9 percent versus last year. Strength sales were up 36.8 percent or 11 percent CAGR, compared to the same period in fiscal 2020, led by the popular SelectTech weights.
- As of June 30, 2022, the Retail segment’s backlog totaled $48.0 million. These amounts represent customer orders for future shipments and are net of contractual rebates and consideration payable to applicable Retail customers.
- Gross profit margins were 5.5 percent compared to 25.1 percent last year. The 19.6 ppt decrease in gross margin was primarily driven by: increased discounting (-11 ppts) and unfavorable logistics overhead absorption (-9 ppts). Gross profit was $1.5 million, a decrease of 95 percent versus last year.
- Segment contribution loss was $5.4 million, or 19.7 percent of sales, compared to segment contribution income of $22.1 million, or 18.3 percent of sales, last year. The decline was primarily driven by lower gross profits.
Balance Sheet and Other Key Highlights as of June 30, 2022
Cash and Liquidity
- Cash, cash equivalents, and restricted cash were $8.7 million, compared to cash, cash equivalents, and restricted cash of $14.2 million as of March 31, 2022. The decrease was primarily due to the net loss, offset by increased debt and changes in working capital.
- Debt and other borrowings were $37.0 million compared to $29.4 million as of March 31, 2022.
- $35.1 million was available for borrowing under the Wells Fargo Asset Based Lending Revolving Facility (“Facility”) compared to $65.8 million as of March 31, 2022.
- Inventory was $103.9 million, down compared to $111.2 million as of March 31, 2022. The decrease in inventory versus year-end was driven by sell-through as we right-size inventory levels ahead of the fitness season. About 8 percent of inventory as of June 30, 2022 was in transit.
- Trade receivables were $27.5 million, compared to $61.5 million as of March 31, 2022. The decrease in trade receivables was due to lower sales and the timing of customer payments.
- Trade payables were $26.8 million, compared to $53.2 million as of March 31, 2022. The decrease in trade payables was primarily due to the timing of payments for inventory.
- Capital expenditures totaled $3.4 million for the three months ended June 30, 2022.
Photo courtesy Nautilus/JRNY


