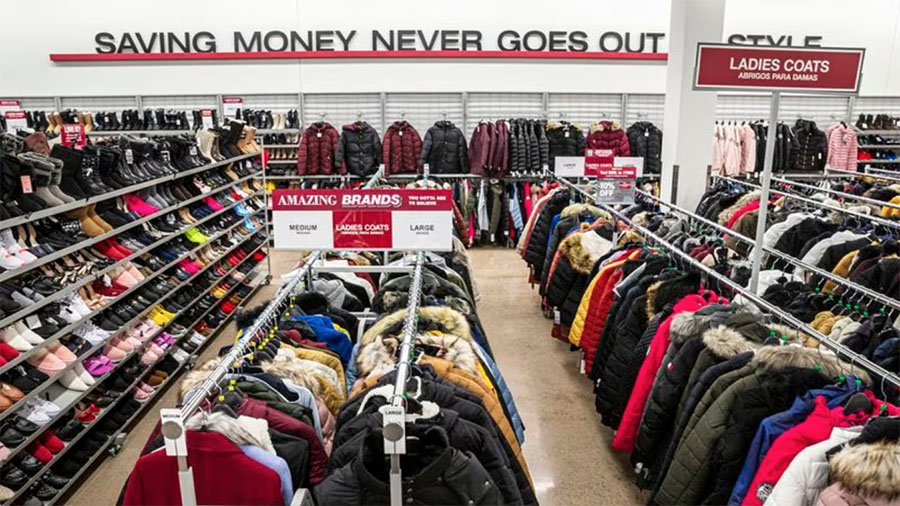
Burlington Stores, Inc. reported fiscal first-quarter total sales increased 11 percent to $2.13 billion for the 13-week period ended April 29, compared to $1.93 billion in the first quarter of fiscal 2022. Comparable store sales increased 4 percent compared to the first quarter of fiscal 2022.
Gross margin improved 130 basis points to 42.3 percent of sales in Q1, compared to 41.0 percent for the first quarter of fiscal 2022. Freight expense improved 150 basis points which were partially offset by a 20 basis point merchandise margin decline, primarily driven by higher markdowns.
Product sourcing costs, which are included in selling, general and administrative expenses (SG&A), were $187 million in Q1 versus $157 million in the year-ago quarter. Product sourcing costs include the costs of processing goods through the supply chain and buying costs.
SG&A was 35.4 percent of net sales in the most recent quarter, compared to 35.3 percent in the year-ago quarter. Adjusted SG&A was 26.5 percent of net sales versus 26.7 percent in the first quarter of fiscal 2022, an improvement of 20 basis points.
The effective tax rate was 24.4 percent versus 8.7 percent in the first quarter of Fiscal 2022. The Adjusted Effective Tax Rate was 24.5 percent vs. 19.2 percent in the first quarter of Fiscal 2022.
Net income was $33 million, or 50 cents per share for the first quarter, more than double the $16 million, or 24 cents per share realized in the year-ago quarter. Adjusted Net Income was $55 million, or 84 cents per share, in Q1, compared to $36 million, or 54 cents per share for the first quarter of fiscal 2022.
Adjusted EBITDA was $157 million in the 2023 first quarter versus $125 million in the first quarter of fiscal 2022, an increase of 90 basis points as a percentage of sales. Adjusted EBIT was $87 million versus $59 million in the first quarter of fiscal 2022, an increase of 100 basis points as a percentage of sales.
Merchandise inventories were $1.23 billion at quarter-end, compared to $1,26 billion at the end of the first quarter of fiscal 2022, a 2 percent decrease. Comparable store inventories increased 10 percent compared to first quarter-end last year. Reserve inventory was 44 percent of total inventory at quarter-end compared to 50 percent at the end of the first quarter last year. Reserve inventory is largely composed of merchandise that is purchased opportunistically and that will be sent to stores in future months or the next season.
Outlook
For the full Fiscal Year 2023 (the 53 weeks ending February 3, 2023), the company expects:
- Total sales to increase in the range of 12 percent to 14 percent, including approximately 2 percent from the 53rd week, on top of a 7 percent decrease in Fiscal 2022, which assumes comparable store sales will increase in the range of 3 percent to 5 percent, on top of the 13 percent decrease during Fiscal 2022;
- Capital expenditures, net of landlord allowances, to be approximately $560 million;
- To open 70-to-80 net new stores;
- Depreciation and amortization, exclusive of favorable lease costs, to be approximately $320 million;
- Adjusted EBIT margin to increase 80 to 120 basis points versus last year;
- Net interest expense to be approximately $63 million;
- An Adjusted Effective Tax Rate of approximately 26 percent; and
- Adjusted EPS to be in the range of $5.50 to $6.00, utilizing a fully diluted share count of approximately 65 million, as compared to Fiscal 2022 diluted EPS of $3.49 and Adjusted EPS of $4.26, which includes an expected benefit from the 53rd week of approximately $0.05 per share.
For the second quarter of Fiscal 2023 (the 13 weeks ending July 29, 2023), the company expects:
- Total sales to increase in the range of 8 percent to 10 percent, which assumes comparable store sales will increase in the range of 2 percent to 4 percent versus the second quarter of Fiscal 2022;
- Adjusted EBIT margin to increase 10 to 50 basis points versus the second quarter of Fiscal 2022;
- An Adjusted Effective Tax Rate of approximately 25 percent; and
- Adjusted EPS in the range of 35 cents to 45 cents, as compared to 18 cents in diluted EPS and 35 cents in Adjusted EPS in Q2 last year.
Photo courtesy Burlington


