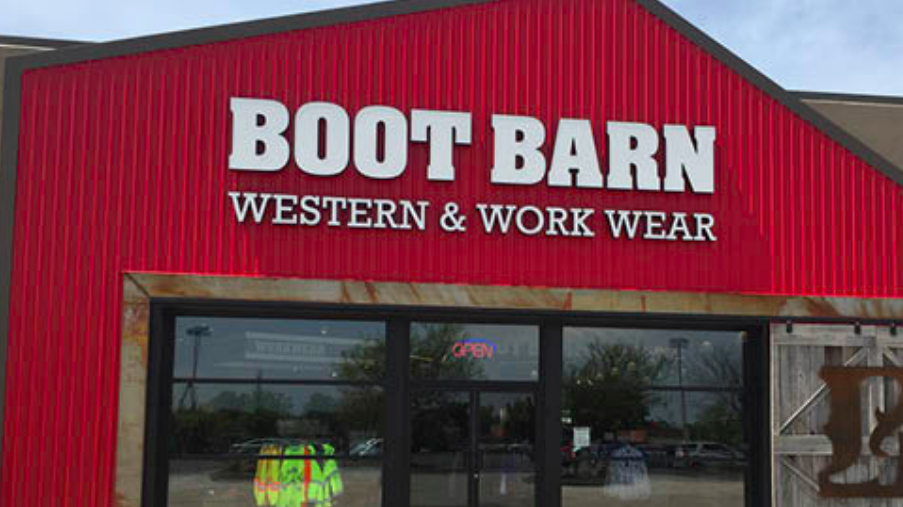
Boot Barn Holdings Inc. reported income for the second quarter ended June 30 of $6.8 million, or 24 cents per diluted share, compared to net income of $0.8 million, or 3 cents per diluted share in the prior-year period.
Net income per diluted share in the first quarter of fiscal 2019 includes approximately 9 cents per share of tax benefit related to stock option exercises.
The company also reported that net sales increased 16.2 percent to $162 million from $139.4 million in the prior-year period. The increase in net sales was driven by an 11.6 percent increase in same store sales and the sales contribution from the addition of 14 stores over the past 12 months.
Highlights for the quarter ended June 30, 2018, were as follows:
- Net sales increased 16.2 percent to $162 million.
- Same-store sales increased 11.6 percent.
- Added 6 stores through new openings and acquisitions.
“We are encouraged by our very strong start to fiscal 2019 as sales, merchandise margin and earnings per share were up significantly year-over-year and outperformed our guidance,” said Jim Conroy, CEO. “Same-store sales increased 11.6 percent, in line with our prior quarter. We expanded our merchandise margin in the quarter by 140 basis points, driven by more full-price selling and increased exclusive brand penetration. I am equally pleased that the positive momentum in the business continued in July.”
Operating Results for the First Quarter Ended June 30, 2018
- Net sales increased 16.2 percent to $162 million from $139.4 million in the prior-year period. The increase in net sales was driven by an 11.6 percent increase in same store sales and the sales contribution from the addition of 14 stores over the past twelve months.
- Gross profit was $51.4 million, or 31.8 percent of net sales, compared to $41.4 million, or 29.7 percent of net sales in the prior-year period. Gross profit increased primarily due to increased sales and an increase in merchandise margin rate. Gross profit rate increased primarily from a 140-basis-point increase in merchandise margin rate and 70 basis points of leverage in buying and occupancy costs. The higher merchandise margin was driven by more full-price selling and increased exclusive brand penetration.
- Selling, general and administrative expense was $41.6 million, or 25.7 percent of net sales, compared to $36.5 million, or 26.2 percent of net sales in the prior-year period. Selling, general and administrative expenses increased primarily as a result of increased sales, higher compensation expense and additional costs for both new and acquired stores. Selling, general and administrative expenses as a percentage of sales decreased as a result of expense leverage on higher sales.
- Income from operations was $9.8 million, or 6.1 percent of net sales, compared to $4.9 million, or 3.5 percent of net sales in the prior-year period.
- Net income was $6.8 million, or $0.24 per diluted share, compared to $0.8 million, or $03 per diluted share in the prior-year period. Net income per diluted share in the first quarter of fiscal 2019 includes approximately $09 per share of tax benefit related to stock option exercises.
- Added 6 stores through new openings and acquisitions, bringing the total count at quarter-end to 230 stores (net of two store closures) in 31 states.
Balance Sheet Highlights as of June 30, 2018
- Cash of $7.4 million.
- Average inventory per store decreased 1.6 percent on a same-store basis compared to July 1, 2017.
- Total net debt of $204.2 million, including $30.7 million drawn under the revolving credit facility.
Fiscal Year 2019 Outlook
For the fiscal year ending March 30, 2019, the company now expects:
- To add 23 new stores, including the six stores added in the first quarter.
- Same-store sales growth of mid-single digits.
- Income from operations between $54 million and $57.9 million compared to the company’s prior outlook of $52.5 million and $56.5 million.
- Interest expense of $17 million to $18 million.
- Net income of $29.9 million to $32.8 million, compared to the company’s prior outlook of $26.2 million to $29.2 million.
- Net income per diluted share of $14 to $1.14 based on 28.8 million weighted average diluted shares outstanding, compared to the company’s prior outlook of $0.92 to $12.
For the fiscal second quarter ending September 29, 2018, the company expects:
- Same-store sales growth of high single digits.
- Net income per diluted share of $07 to $09 based on 28.8 million weighted average diluted shares outstanding.


