By Thomas J. Ryan
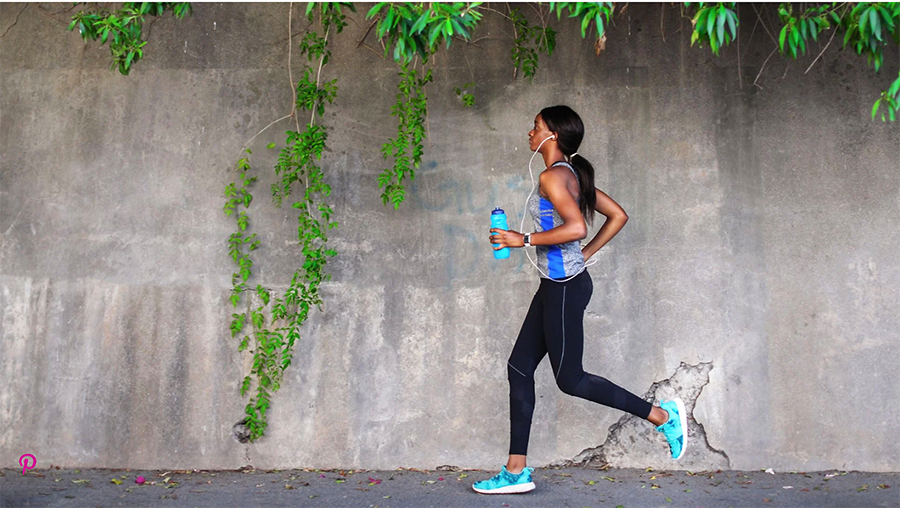
<span style="color: #a1a1a1;">According to Running USA’s “National Runner Survey 2020,” social media continues to play an increasing role in enabling runners to connect with running stores, running brands as well as the overall running community.
Asked who they follow on social media, the top answer was running stores, cited by 39 percent of respondents, up from 32 percent in the prior year’s survey. A third indicated they follow running brands in the latest survey, up from 30 percent the prior year.
What else do they follow on social media?
Elite runners came in at 35 percent; local runners, 33 percent; bloggers, 12 percent; celebrities, 8 percent. Thirty-seven percent indicated they don’t follow any running-related pages. About half (51 percent) like to share their race experience with others via social media.
Asked what else they use apps for, the top two answers were apps help them train better (i.e. track progress, avoid injuries, etc.), cited by 67 percent; and they feel good to see what they ran, 57 percent. Forty percent like to have, or track, all their running statistics to see how they compare with other runners, 29 percent like to take pictures while they’re participating in an event; and 14 percent like to share the information with a running coach or others on social media via an app.
Facebook was found to be by far the most popular social media platform for runners.
Facebook ranked first as the top overall channel for race information, cited by 37 percent; followed by race-specific sites, 29 percent; registration sites, 26 percent; e-mail, 24 percent; and word-of-mouth/referral, 18 percent.
Further probing the use of social media platforms, the survey found 58 percent post race photos and videos on Facebook; followed by 34 percent doing so on Instagram. Only 5 percent post race photos and videos on Twitter, 3 percent on Snapchat, and zero percent on Pinterest. Generally, similar responses were found when runners were asked about sharing their current training, posting general running photos/videos, following other (non-professional) runners, looking for running advice and looking for running inspiration. One difference was that about 11 percent of respondents use Pinterest for advice and inspiration.
…
<span style="color: #a1a1a1;">Running USA’s survey explored brand preferences for the first time. Asked about their favorite brand of running shoes, Brooks* came in first, cited by 31 percent; followed by Asics, 12 percent; New Balance, 10 percent; Nike, 10 percent; Saucony, 10 percent; Hoka One One, 9 percent; Mizuno, 5 percent; Altra, 4 percent; Adidas, 3 percent; Newton, 1 percent; On, 1 percent; and Merrell, 1 percent.
Asked about their favorite running apparel brand, Nike came in first, at 24 percent; followed by Under Armour, 17 percent; Brooks, 9 percent; Lululemon, 7 percent; Adidas, 5 percent; Asics, 4 percent; Oiselle, 2 percent; Reebok, 2 percent; Smartwool, 2 percent; and Saucony, 2 percent.
Runners spend an average of nearly $1,800 per year on running-related items, according to the survey. Among products, running shoes came in first with an average spend of $299; followed by running apparel, $199; and running technology (watches, etc.), $119. Respondents were found to spend an average of $435 on race registration fees, $604 on travel for races and $139 for medical needs.
Initially launched in 2007, this year’s survey featured more than 3,500 runners and was taken last winter.
Other core findings from the survey:
- Runner demographics: Six in ten runners are female. Half are between the ages of 35 to 54. Seventy-one percent are married. Half have an income of at least $100,000. Most consider themselves to be healthy.
- Runner profile: On average, the respondents have been running for 14 years and run an average 22 miles a week. Half run at least 4 days a week. Six in 10 belong to a running group of some kind. Half prefer to run by themselves.
- Running motivation: Staying healthy was the number one goal in 2020 and a top reason for running. About four in ten have a race-related goal, including running a half marathon or marathon, setting a PR, and running a new race.
- Race participation: Runners report running an average of 10 events in the last 12 months. The half marathon continues to be the favored running distance. The 5K has the highest level of participation.
- Race barriers: Two-thirds would participate in more events with lower entry fees. Two-thirds feel race fees are too expensive. Six in 10 feel they receive good value for their race entry fee. Runners are willing to pay a higher entry fee when the event benefits an important cause, the location is convenient and they like the SWAG (t-shirt and medal).
*Last week, Brooks Running launched a shoe donation program providing 10,000 pairs of shoes in support of health care professionals working across the U.S. to keep our communities healthy during the coronavirus pandemic. Health care workers can visit brooksrunning.com and sign up with their name, address, shoe size and the name of their employer and Brooks will send them a free pair of shoes. Photo courtesy Brooks Running

