Shoe Carnival, Inc. reduced its annual guidance for the third straight quarter after reporting sales softened after Labor Day in part due to unseasonably hot weather in September and October. Same-store sales declined 7.4 percent in the quarter and are expected to decline in the range of 9 percent to 12 percent in the fourth quarter.
Highlights
- Total quarterly net sales were down 6.4 percent; Unseasonably hot weather in September and October resulted in soft seasonal and non-athletic fall sales at Shoe Carnival stores.
- Shoe Station’s net sales increased low double-digits in third quarter 2023 versus the prior year and its results were accretive to the company’s operating income margin.
- Children’s category sales grew low-single digits during Back-to-School, resulting in continued market share gains and the second-highest category sales in the company’s 45-year history.
- Gross profit margin of 36.8 percent exceeded 35 percent for the 11th consecutive quarter.
- Dividend increased 20 percent during the quarter and now represents a 166 percent increase compared to three years ago.
- Annual guidance has been lowered, reflective of soft seasonal sales and limited visibility on customer holiday shopping.
“Our team delivered a successful Back-to-School season, with solid growth in the children’s business, double-digit Shoe Station banner growth and continued market share gains in the family footwear channel. After Labor Day, Shoe Carnival banner results softened and were below our expectations, as persistently hot and dry weather led to soft seasonal sales and a sluggish start to the boot season,” said Mark Worden, president and chief executive officer.
“Despite near-term sales headwinds, our robust gross profit margins, debt-free balance sheet and strong cash flow generation position the company well to pursue additional growth initiatives and M&A opportunities in 2024,” concluded Worden.
Third Quarter Operating Results
Net sales were $319.9 million, down 6.4 percent in the quarter compared to third quarter 2022 and comparable store sales were down 7.4 percent, primarily due to softening trends after Labor Day. August net sales, driven by a successful back-to-school season, were the second-highest kid’s category sales in the company’s 45-year history. Trends softened versus the prior year in Shoe Carnival stores after Labor Day as sales of seasonal and fall merchandise were slow due primarily to unseasonably warm weather. Sales in September and October resulted in high single-digit comparable sales declines with seasonal boot comparable sales declining in the low-twenties for the entire third quarter.
The Shoe Station banner increased net sales by low double-digits in the quarter compared to third quarter 2022, led by sales from new stores and the launch of the Shoe Station e-commerce site in early 2023.
The company’s total e-commerce sales increased nearly 10 percent in third quarter 2023 compared to third quarter 2022 demonstrating the company’s effectiveness with investments in digital marketing and CRM.
Gross profit margin in third quarter 2023 was 36.8 percent, marking the 11th consecutive quarter the company’s gross profit margin exceeded 35 percent. Increased gross profit margin over the long term has been a key driver of the company’s profit transformation. Compared to third quarter 2019, gross profit margin expanded by 590 basis points. The near-term 150 basis point gross profit margin decline compared to third quarter 2022 was primarily due to the unseasonable fall weather, which slowed boot sales and led to increased promotions of seasonal merchandise in September and October.
SG&A expenses were $89.8 million in third quarter 2023, or 28.1 percent of net sales. The increase of $2.5 million in the quarter versus the prior year reflected an increase in advertising investment which drove growth in children’s sales during the Back-to-School season and market share gains over the entire quarter.
The effective tax rate in third quarter 2023 of 23.8 percent was lower than the prior year’s rate of 25.6 percent. The effective tax rate for the full year is expected to be between 23 and 24 percent compared to 25.2 percent in 2022.
Third quarter 2023 net income was $21.9 million, or $0.80 per diluted share, compared to third quarter 2022 net income of $32.7 million, or $1.18 per diluted share. Results were below expectations given the unfavorable weather trends experienced post-Labor Day and have resulted in lower full-year 2023 expectations for the company. Compared to the company’s longer-term historical profit results, third quarter 2023 EPS of $0.80 is more than any full-year EPS prior to fiscal 2018.
Fiscal 2023 Earnings Outlook
A softer-than-expected start to the fall seasonal categories has continued into November. In addition, there is uncertainty regarding customer holiday shopping and broader macro-economic conditions remain volatile. The company now expects to deliver on the following annual guidance for 2023, which includes 53 weeks compared to 52 weeks in 2022:
The updated guidance calls for:
- Diluted earnings per share (EPS): $2.65 to $2.75 (prior, $3.10 to $3.25)
- Net sales (in billions): $1.16 to $1.18 (prior, $1.19 to $1.21)
- Gross profit margin: ~36 percent (prior, 36 percent to 37 percent)
- SG&A (in millions): $323 to $327 (prior, $321 to $327)
- SG&A as a percent of net sales: 28 percent (prior, 27 percent)
- Operating income (in millions): $92 to $96 (prior, $109 to $116)
- Net income (in millions): $72 to $75 (prior, $85 to $89)
- Cash flows from operations (in millions): $105 to $115 (prior, $120 to $130)
- Capital expenditures (in millions): $48 to $53 (prior, $55 to $65)
- Merchandise inventories (in millions): $40 (same as before)
- Comparable store sales: -8.5 percent to -9.5 percent (prior, -8 percent to -6 percent)
- New stores: 6 (Prior, 6 to 10)
Merchandise Inventory
The company’s inventory optimization improvement plan continued to progress ahead of target, with third quarter 2023 ending inventory 6 percent lower than the prior year. The company remains on track to achieve further inventory efficiencies this year and expects year-end inventory dollars to be down over 10 percent versus fiscal 2022 year-end.
Store Count, Modernization and Planned Store Growth
In October 2023, the company opened its 401st store, now operating 373 Shoe Carnival stores and 28 Shoe Station stores. Store productivity and profitability have increased significantly for the fleet since the last time the company operated 400 stores in 2018.
The company continues to modernize its fleet through a multi-year remodel program. As of October 28, 2023, 55 percent of the fleet modernization was complete and is expected to approach two-thirds complete in the summer of 2024.
The company has a strategic growth roadmap in place to surpass 500 stores and aims to be a multi-billion dollar retailer in 2028, inclusive of organic growth and strategic M&A activity.
As an extension to its store modernization program, the company modernized and relaunched its shoecarnival.com website in late October 2023 and earlier in the year launched the shoestation.com website. Combined with advanced CRM capabilities, these investments enhance the customers’ omnichannel interaction with the company and support the company’s ability to drive long-term, sustainable growth. The relaunched website incorporates improvements in search capability, use of predictive analytics, and improved product imagery and speed of operation.
Capital Management
The 2022 fiscal year-end marked the 18th consecutive year the company ended a year with no debt, and through year-to-date November, the company continued to fund its operations without debt. At the end of third quarter 2023, the company had approximately $71 million of cash, cash equivalents and marketable securities and approximately $100 million in borrowing capacity. Compared to third quarter 2022, cash and cash equivalents increased by almost $23 million in third quarter 2023 and cash flow from operations increased over $50 million year-to-date 2023 compared to year-to-date 2022. The company’s continued strong operating cash flow generation is expected to more than fully fund store remodels and growth planned in the balance of 2023 as well as provide the capacity to invest further in internal and external growth opportunities in 2024 if conditions are appropriate.
Dividend and Share Repurchase Program
In September 2023, the company’s Board of Directors approved a dividend increase of 20 percent. The dividend was paid on October 17, 2023, to shareholders of record as of the close of business on October 3, 2023. With the increase in the quarter, the company has increased its dividend by 166 percent since third quarter 2020 and has paid 46 consecutive quarterly dividends.
During the quarter, the company repurchased 230,696 shares at a weighted average price per share of $23.60, totaling approximately $5.4 million. As of October 28, 2023, the company had approximately $44.6 million available for future repurchases under its $50 million share repurchase program if deemed appropriate.
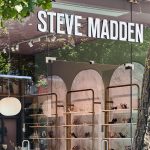
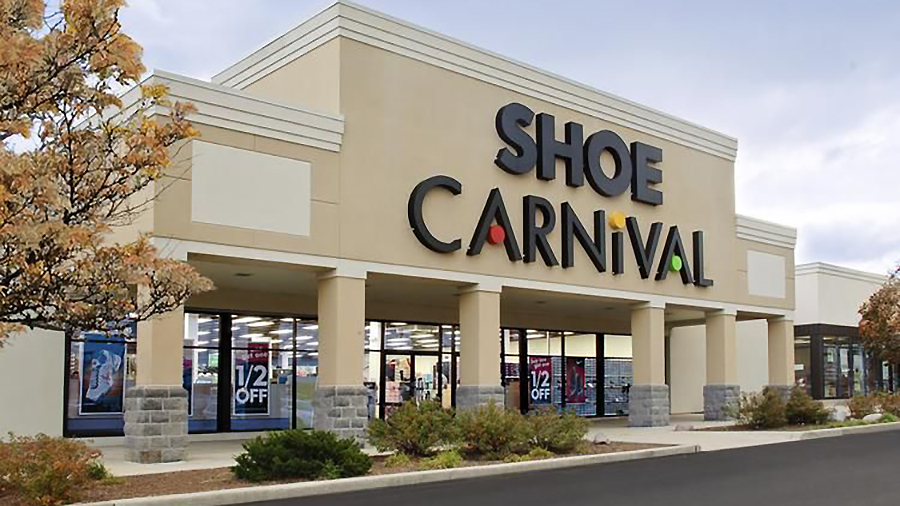
Photo courtesy Shoe Carnival