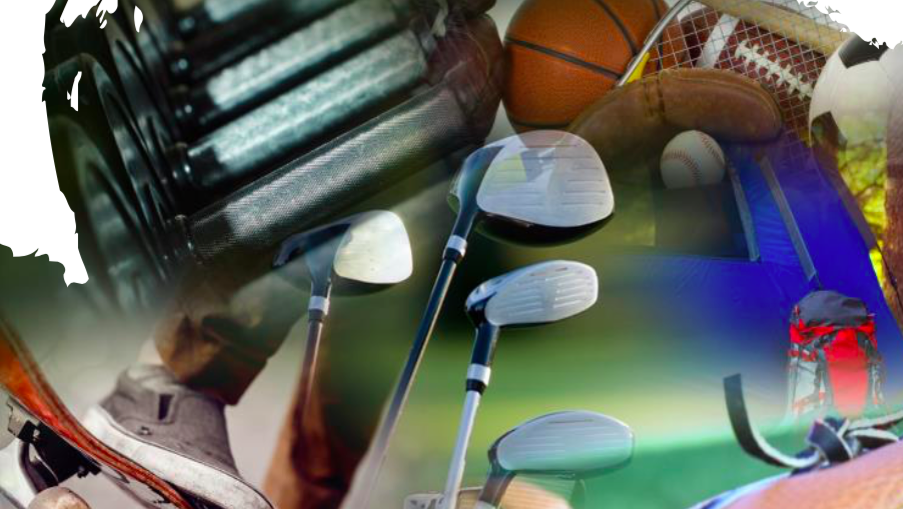
SFIA’s 2018 Manufacturers’ Sales Report showed sales in the sports and fitness industry grew 2.9 percent in 2017, representing the best annual growth in three years. Strong category performance was seen in basketballs, batting gloves, camping coolers, sports bras, fitness/workout footwear and fishing equipment.
The report is based on the U.S. wholesale dollar sales data of sports equipment, exercise equipment, activewear apparel, sports apparel, licensed merchandise and footwear.
“The sports and fitness products industry is resilient,” said Tom Cove, president and CEO of SFIA, in a statement. ”Though we have faced profound changes in retail landscape and consumer behavior, the industry continues to innovate and deliver products that Americans want, in order to maintain their desired active lifestyle.”
Total sports equipment sales increased 3.1 percent to $24.9 billion. Among larger categories, strong gains were seen in camping, up 3.3 percent, to $2.6 billion, led by an 18.5 percent gain in coolers/chests. The laggard in the camping category was tents/shelters, off 6.5 percent. Backpacks and sleeping bags/airbeds were both up 1 percent.
Other bigger categories in sports equipment showing notable gains were firearms, up 3.3 percent and fishing, ahead 3.5 percent. Optical goods jumped 15.7 percent and water sports added 2.5 percent.
A notable laggard in equipment was snow sports, which declined 8.3 percent, with double-digit drops in snow skiing, x-country and snowboards. Football equipment also fell short, sliding 2.2 percent. Among other team sports equipment categories, basketball grew 2.5 percent, while lacrosse and volleyball were ahead 2.4 percent and 2.3 percent, respectively. Baseball grew slightly, while soccer and ice hockey were down minimally.
Total exercise equipment sales eased 0.2 percent to $5.18 billion. Institutional exercise products were slightly up while consumer exercise products were slightly down. Among consumer exercise products, declines were seen in treadmills and home gyms, both down 2.8 percent and elliptical machines, off 1.8 percent. Modest gains on the consumer side were seen in exercise cycles, free weights and ab machines.
Total sports apparel grew 3.1 percent to $36.1 billion. In branded athletic apparel, robust growth was seen in socks, up 4.9 percent; sports bras, 4.2 percent and underwear, up 3.7 percent. Shirts/tops was also up 3.7 percent and warm-ups added 3.1 percent, but the large fleece/sweat category was flat. Branded outerwear was ahead 1.8 percent.
Total team uniforms were flat at $1.27 billion. Soccer showed the largest gain, up 2.6 percent, while football lost 3.6 percent.
Total licensed merchandise grew 3.5 percent to $8.2 billion.
After an unpredictable few years in the footwear industry, where the classic/original brand styles have been increasing at a faster rate than any other category, fitness/workout footwear is now outpacing the classic/original styles. While both categories are showing steady, healthy gains, sales of fitness/workout footwear increased 5.3 percent, while classic/originals advanced 3.3 percent. The running shoe category continues to dominate the shoe market, grossing nearly double the amount of any other footwear category, and maintains strong, consistent growth at 2.1 percent.
Overall athletic footwear were up 2.6 percent to $15.8 billion. Other healthier gains were seen in kids, up 4.1 percent; basketball, 2.8 percent; sport sandals/slides, 5.0 percent; outdoor/adventure, 2.5 percent and golf, 1.9 percent. Laggards included football, down 2.2 percent; tennis, eroding 2.0 percent and walking, easing 0.5 percent. Skate/surf was flat.
In team footwear, football again lagged, down 2.2 percent. Basketball and baseball were both ahead 2.8 percent.
Photo courtesy SFIA

