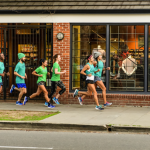
In spite of a 3% decline, exercise walking, remains the No. 1 participation activity surveyed by the National Sporting Goods Association (NSGA), a position it has held for more than a decade. Data contained in NSGAs annual “Sports Participation Series I and II” reports, which will be available later this month, shows 79.5 million Americans walked for exercise in 2003.
Camping, which replaced swimming as the No. 2 activity in 2002, attracted 51.4 million Americans in 2003. In spite of a 7.2% decline, camping remains ahead of exercising with equipment, which rose 4% to 48.6 million participants and secured the No. 3 position. Swimming slipped to No. 4 with 47 million participants, an 11% decline. Bowling rounded out the top five with 39.4 million.
After a strong showing in 2002, fitness activities showed modest growth or declines in 2003. The leader in percentage growth among fitness activities was exercising with equipment, up 4%, followed closely by weightlifting, with an increase of 3.1%. Weightlifting attracted 25.9 million participants in 2003. In 2003, 29.5 million people indicated they worked out a club, a 1.9% increase versus 2002.
Showing modest declines were exercise walking (down 3.3% to 79.5 million) and aerobic exercising (down 3.4% to 28.0 million). Running/jogging drew 22.9 million participants, a decline of 7.3%.
With the exception of tackle football (8.7 million, up 10.9%), all team sports showed participation declines in 2003. Basketball, the highest-ranking team sport (27.9 million participants), slipped 3.7% in 2003. Second-ranked baseball (14.6 million) fell 6.3%; third-ranked softball (11.8 million) declined 13.1%; and fourth-ranked soccer (11.1 million) dropped 19.1%.
Volleyball (10.4 million) and touch football (9.3 million) also showed declines, 8.8% and 9.9% respectively.
For this survey, a participant is someone age seven or older who takes part in the sport or activity more than once in a calendar year. “Sports Participation in 2003 Series I and II” cover 44 sports, recreation and fitness activities.
These reports have been published by NSGA for the last 18 years. They provide data on total 2003 participation, frequency of participation, and average number of participation days. Single-time participation, which is not counted in the total, is included separately.
Demographic data on participants includes gender, age, mean age by gender, gender by age, household income, and education of male and female head of household. Geographic analysis includes nine census regions and metro area size. Presence of children is also noted, and Internet usage is reported by gender and age of participants.
In addition to Series I and II, state-by-state data is available in “Sports Participation in 2003: State-By-State.” This report covers 33 sports and activities, and provides data on total participation, frequency of participation and total participation days.
For more information on pricing for these and other NSGA research reports, please contact the NSGA Research Department, (800) 815-5422, ext. 108, or e-mail: info@nsga.org. Information is also available on the NSGA web site, www.nsga.org.
Founded in 1929 and celebrating its 75th anniversary in 2004, NSGAs mission is to help all members profit in a competitive marketplace. The Association organizes and hosts the annual NSGA Management Conference & Team Dealer Summit, the sporting goods industrys premier educational and networking event. The 2004 Conference/Summit will be held May 16-19 at the Hilton Head Marriott Beach & Golf Resort, Hilton Head Island, S.C.
For more information on NSGA member services, visit the Association home page (www.nsga.org); call Rhonda Onuszko at NSGA, (847) 296-6742, Ext. 130; e-mail: info@nsga.org; or fax (847) 391-9827.
1		Exercise Walking	        79.5 	-3.3%
2		Camping (vacation/overnite)	51.4 	-7.2%
3		Exercising with Equipment	48.6 	3.9%
4		Swimming	                47.0 	-11.4%
5		Bowling	                        39.4 	-7.1%
6		Fishing	                        38.2 	-13.7%
7		Bicycle Riding	                36.3 	-8.7%
8		Billiards/Pool	                30.5 	-8.0%
9		Aerobic Exercising	        28.0 	-3.4%
10		Basketball	                27.9 	-3.7%
11		Weight Lifting	                25.9 	3.1%
12		Golf	                        25.7 	-5.4%
13		Hiking	                        25.0 	-8.0%
14		Boating, Motor/Power	        24.2 	-9.1%
15		Running/Jogging	                22.9 	-7.3%
16		Hunting with Firearms	        17.9 	-8.1%
17		Target Shooting	                17.0 	-10.0%
18		Roller Skating (in-line)	16.0 	-15.3%
19		Baseball	                14.6 	-6.3%
20		Backpack/Wilderness Camp	13.7 	-7.3%
21		Softball	                11.8 	-13.1%
22		Scooter Riding	                11.6 	-13.0%

23		Soccer	                        11.1 	-19.1%
24		Volleyball	                10.4 	-8.8%
25		Tennis	                         9.6 	-12.7%
26		Football (touch)	         9.3 	-9.6%
27		Skateboarding	                 9.0 	-7.1%
28		Football (tackle)	         8.7 	10.9%
29		Mountain Biking (off road)	 8.2 	5.6%
30		Paintball Games	                 7.4 	6.8%
31		Skiing (alpine)	                 6.8 	-8.5%
32		Snowboarding	                 6.3 	12.9%
33		T'ai Chi/Yoga	                 5.6 	-8.6%
34		Water Skiing	                 5.5 	-20.7%
35		Ice/Figure Skating	         5.1 	na
36		Hunting w/Bow & Arrow	         5.0 	6.8%
37		Martial Arts	                 4.8 	15.0%
38		Kayaking/Rafting	         4.7 	na
39		Archery (target)	         3.9 	-7.6%
40		Muzzleloading	                 3.1 	-13.9%
41		Kick Boxing	                 3.0 	na
42		Sailing	                         2.6 	na
43		Skiing (cross country)	         1.9 	-12.1%
44		Hockey (ice)	                 1.8 	-12.3%


