Helen of Troy Ltd. CEO Noel Geoffrey told the participants of a conference call with analysts that the company that is home to the Osprey Packs and Hydro Flask brands took decisive actions toward its long-term strategic initiatives, including strengthening the core and further shaping its growth portfolio.
“In addition, despite persistent macro headwinds, we are generating results on our efforts to reset and revitalize our business, which we believe indicates we are on the right path to improve our operating performance, Geoffrey added. “Through our increasingly data-driven approach, we continue to see improvement in our brand fundamentals. Project Pegasus continues to be on track and is generating critical fuel for reinvestment in our brands. This fuel, combined with our sharper brand fundamentals, is leading to stronger marketing with new creative, new more agile media campaigns, better innovation, and better execution. We are also continuing to grow our distribution.”
He said the company “meaningfully grew” its U.S. weighted distribution by 9 percent year-over-year, making the company’s brands increasingly available where shoppers shop.
“All of these efforts contribute to improved market share performance, with eight of our key categories growing or maintaining share this fiscal year-to-date in our U.S. measured channels,” Geoffrey noted.
Wall Street apparently like what it heard on the call as HELE shares jumped nearly 18 percent for the day on Wednesday, October 9. The company posted sales and earnings that beat the market’s expectations and earnings guidance that beat Wall Street’s target.
Fiscal second quarter consolidated company sales decreased 3.5 percent to $474.2 million due to declines in the company’s Beauty & Wellness segment, but surpassed analysts’ consensus estimate of $458.24 million.
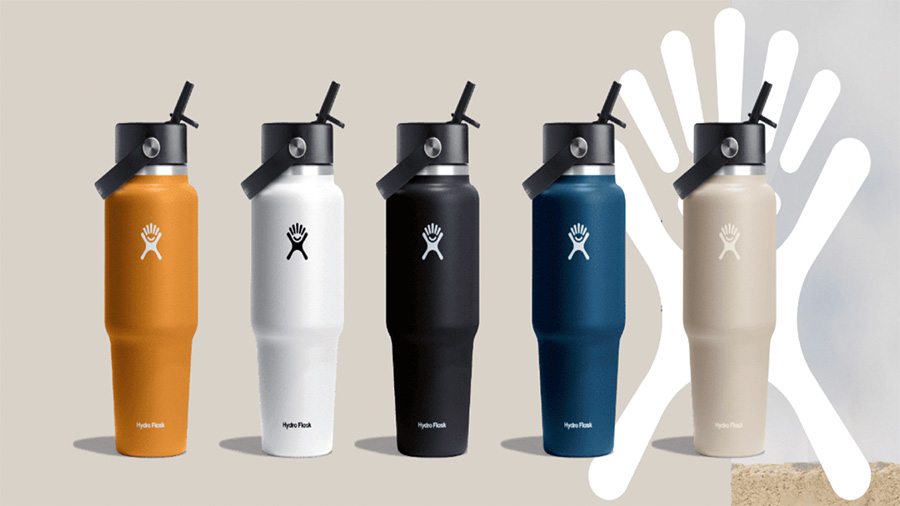
The Home & Outdoor segment, which includes OXO, Hydro Flask and Osprey, increased 0.8 percent to $241.9 million in the second quarter ended August 31. Higher sales in the [Hydro Flask] insulated beverageware category and improving trends with OXO helped offset continued softness in Osprey technical packs and related accessories.
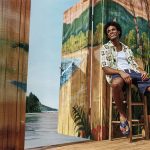
Hydro Flask reportedly outperformed expectations and was called out by CEO Geoffrey as a key example of brand revitalization across innovation, distribution, and marketing.
“We still have many areas of opportunity, but are encouraged by our meaningful progress across all key focus areas,” Geoffrey noted. “The new Travel Bottle was launched in the second quarter and provides consumers with the best of both worlds, the utility of fitting in most car cupholders or backpack pockets, and it is leak-proof.”
He said the new bottle comes with a choice of a Hydro Flask flip straw or chest cap along with a convenient carrying strap.
“Hydro Flask also successfully launched into Costco, a key retailer for [an] expanded target consumer,”Geoffrey detailed. “The brand also benefited from strong distribution internationally with sales up in all key markets.”
Hydro Flask also launched a new brand campaign called, We Make It, You Own It, during the quarter. Geoffrey saids the campaign celebrates the individuality of the Hydro Flask consumer and highlights the broad array of products, configurations, and colors the brand offer for a wide range of consumer preferences and occasions.
Hydro Flask created a Brat Summer water bottle that was promoted on its social media account. An Instagram post reportedly achieved Hydro Flask’s highest year-to-date engagement rate, drove a double-digit lift in sales around the post, and gained the attention of Charli XCX, leading to a new partnership for her current concert tour and great overall exposure for the brand.
“Our second cultural moment came in late summer when the VMA’s Best New Artist winner walked the red carpet and sat in the front row with a custom Hydro Flask in hand,” Geoffrey noted proudly. “Social engagement on that post have now eclipsed our Brat Summer post. These are two great examples of moving at the speed of culture, which is critical to driving relevance with our target consumer.”
Osprey Packs is maintaining its leading share in U.S. technical packs even as that category softened once again.
“Osprey continues to extend into exciting new adjacencies. A great example that is rooted in consumer obsession is Osprey’s new photography accessories line,” the CEO said. “After years of consumers asking us for photography gear, and extensive research and testing by Osprey, we launched our new photography accessories line in July. The line is built around the PhotoLid, an innovative padded camera case that support[s] active photographers and content creators and [is] designed to replace the removable top lid on most backpacks, while also offering accessible and protective storage for photo gear.”
Geoffrey said the new line has received strong consumer engagement and a tremendous response from the industry. He said that in Everyday Packs and Lifestyle Packs, Osprey is having strong success with its Daylite line, which is driven by “new color designs, Osprey’s high-quality materials and durability, and an affordable price point that caters to consumers in the current economic environment.” He said the line continues to offer extended distribution opportunities for the brand.
Helen of Troy said the increase in the segment was also driven by higher international sales, primarily driven by new and expanded retailer distribution, and expanded retailer distribution in the Home category. These factors were partially offset by softer consumer demand, lower replenishment orders from retail customers, as well as the weakness in technical packs and related accessories.
“Internationally, our businesses performed well with sales up almost 5 percent and all key regions contributing to the positive growth,” Geoffrey reported. “Home & Outdoor outperformed our expectations and grew in all key international markets, driven by expanded distribution and greater collaboration between the brand and sales teams. Hydro Flask expanded into GO Outdoors flagship stores. Osprey is well represented in Germany with a large display at Sport Schuster, Munich’s leading sporting goods retailer. These are just a few examples of how we are increasing our global footprint.”
Home & Outdoor segment operating income declined 13.6 percent to $31.2 million, or 12.9 percent of segment net sales revenue, in the second quarter ended August 31, compared to $36.1 million, or 15.0 percent of segment net sales revenue, in the prior-year Q2 period.
The decrease in segment operating margin was said to be primarily due to unfavorable distribution center expense, a less favorable product and customer mix, and higher marketing expense as the segment reinvested back into its brands. These factors were reportedly offset in part by lower overall personnel expense, which includes the impact of lower annual incentive compensation expense, and favorable inventory obsolescence expense year-over-year.
Segment Adjusted operating income decreased 14.5 percent to $36.3 million, or 15.0 percent of segment net sales revenue, in fiscal Q2, compared to $42.4 million, or 17.7 percent of segment net sales revenue in the year-ago comparative period.
Looking ahead, Helen of Troy now expects Home & Outdoor net sales to range from a decline of 2.3 percent to growth of 1.4 percent, which includes the impact of shipping disruption in the company’s Tennessee distribution facility during the first quarter of fiscal 2025, compared to the prior expectation of a decline of 3.0 percent to 1.0 percent.
Companywide, Helen of Troy reported adjusted income decreased 34.1 percent, to $27.5 million, compared to $41.8 million. Adjusted diluted EPS decreased 30.5 percent to $1.21 compared to $1.74 but topped analysts’ consensus estimate of $1.05.
Helen of Troy had forecast a decline in adjusted diluted EPS of approximately 45 percent to 35 percent and a drop in net sales in the range of 7 percent to 4 percent.
Image courtesy Hydro Flask