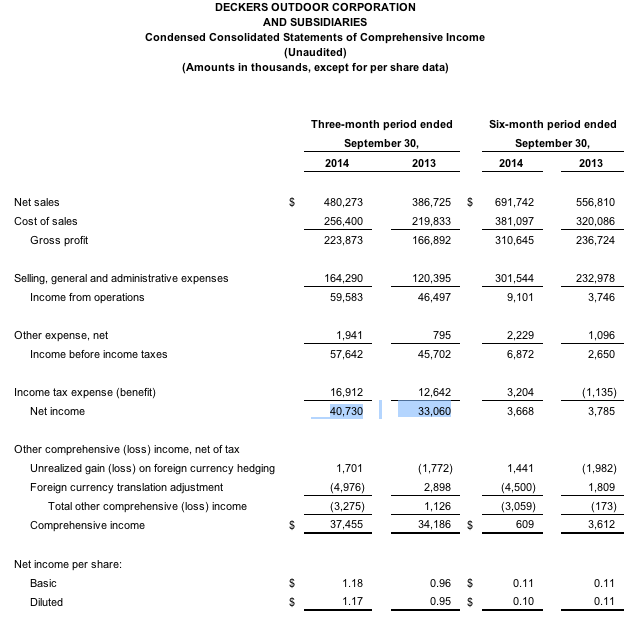
Deckers Brands reported sales increased 24.2 percent in the second quarter ended Sept. 30, to $480.3 million compared to $386.7 million for the same period last year. Earnings rose 23.2 percent to $40.7 million, or $1.17 a share.
Second Quarter Fiscal Year 2015 Financial Review
- Net sales increased 24.2 percent to a record $480.3 million compared to $386.7 million for the same period last year.
- Gross margin increased 340 basis points to 46.6 percent compared to 43.2 percent for the same period last year.
- SG&A expenses as a percent of net sales were 34.2 percent compared to 31.1 percent for the same period last year.
- Diluted earnings per share increased 23.2 percent to $1.17 compared to $0.95 for the same period last year.
- Ugg brand sales increased 23.8 percent to $417.1 million compared to $337.0 million for the same period last year.
- Teva brand sales increased 14.9 percent to $20.7 million compared to $18.0 million for the same period last year.
- Sanuk brand sales increased 3.2 percent to $19.0 million compared to $18.4 million for the same period last year.
- Other Brands sales increased 76.5 percent to $23.5 million compared to $13.3 million for the same period last year.
- Direct-to-Consumer comparable sales, which include worldwide retail same store sales and worldwide comparable E-Commerce sales, increased 3.3 percent over the same period last year.
- Retail sales increased 20.1 percent to $63.2 million compared to $52.6 million for the same period last year.
- E-Commerce sales increased 45.1 percent to $21.6 million compared to $14.9 million for the same period last year.
- Domestic sales increased 21.1 percent to $289.1 million compared to $238.8 million for the same period last year.
- International sales increased 29.2 percent to $191.2 million compared to $147.9 million for the same period last year.
“Our second quarter results reaffirm that Deckers Brands is a growth company,” commented Angel Martinez, President, Chief Executive Officer and Chair of the Board of Directors. “Both our revenues and earnings grew more than 20 percent for the second quarter compared to the same period last year driven by the performance of our strongest, most diversified product line up ever. We believe that consumers are responding positively to the combination of sharper price points, innovation and enhanced aesthetics. At the same time, we plan to continue to focus on marketing programs and Omni-Channel initiatives to effectively communicate our product stories and drive increased conversions in our Direct-to-Consumer channel. We believe that we are well positioned for another successful holiday season, and more importantly, to drive growth for many years to come.”
Division Summary
UGG Brand
UGG brand net sales for the second quarter increased 23.8 percent to $417.1 million compared to $337.0 million for the same period last year. The increase in sales was driven by higher global wholesale sales, the sales contribution from new worldwide retail store openings and an increase in global E-Commerce sales, partially offset by a decrease in same store sales and international distributor sales. The decrease in international distributor sales is mainly due to the conversion of the German market from distributor to direct wholesale.
Teva Brand
Teva brand net sales for the second quarter increased 14.9 percent to $20.7 million compared to $18.0 million for the same period last year. The increase in sales was driven by higher domestic wholesale sales and global E-Commerce sales, partially offset by a decrease in international wholesale and distributor sales.
Sanuk Brand
Sanuk brand net sales for the second quarter increased 3.2 percent to $19.0 million compared to $18.4 million for the same period last year. The increase in sales was driven by higher global E-Commerce sales, domestic retail sales and international wholesale and distributor sales, partially offset by a decrease in domestic wholesale sales.
Other Brands
Combined net sales of the company’s other brands increased 76.5 percent to $23.5 million for the second quarter compared to $13.3 million for the same period last year. The increase was primarily attributable to a $9.3 million increase in sales for the HOKA ONE ONE® brand compared to the same period last year.
Retail Stores
Sales for the global retail store business, which are included in the brand sales numbers above, increased 20.1 percent to $63.2 million compared to $52.6 million for the same period last year. The increase was driven by 33 new stores opened after September 30, 2013, partially offset by a same store sales decrease of 8.8 percent for the thirteen weeks ended September 28, 2014 compared to the thirteen weeks ended September 29, 2013.
E-Commerce
Sales for the global E-Commerce business, which are included in the brand sales numbers above, increased 45.1 percent to $21.6 million compared to $14.9 million for the same period last year. The increase was driven primarily by strong domestic and international sales for the UGG, Teva and Sanuk brands, plus the domestic launch of the HOKA ONE ONE brand website and the addition of new international E-Commerce websites.
Balance Sheet
At September 30, 2014, cash and cash equivalents were $114.7 million compared to $84.1 million at September 30, 2013. The company had $154.6 million in outstanding borrowings under its credit facility at September 30, 2014 compared to $245.5 million at September 30, 2013. The increase in cash and cash equivalents and the decrease in outstanding borrowings are primarily attributable to cash provided by operations and proceeds from the loan on the corporate headquarters, partially offset by cash payments primarily attributable to capital assets and increasing inventory levels.
Inventories at September 30, 2014 increased 8.3 percent to $481.7 million from $444.6 million at September 30, 2013. By brand, UGG inventory increased 7.6 percent to $429.5 million at September 30, 2014, Teva inventory decreased 34.7 percent to $14.1 million at September 30, 2014, Sanuk inventory increased 39.2 percent to $17.4 million at September 30, 2014, and the other brands inventory increased 81.4 percent to $20.7 million at September 30, 2014.
Full Fiscal Year 2015 Outlook for the Twelve Month Period Ending March 31, 2015
- The company now expects fiscal year 2015 revenues to be approximately $1.825 billion or 15 percent over the twelve month period ended March 31, 2014, up from the previous guidance of 14 percent.
- The company now expects fiscal year 2015 diluted earnings per share to be approximately $4.71 or 15.8 percent over the twelve month period ended March 31, 2014, up from the previous guidance of 14.5 percent. This guidance assumes a gross profit margin of approximately 49 percent and an operating margin of approximately 13 percent.
- The company expects fiscal year 2015 SG&A expenses as a percentage of sales to be approximately 36 percent. Among other items, these expenses include increased marketing and supply chain costs, investments in IT infrastructure, expenses related to management reorganization, and operating costs associated with opening new stores in 2013 and 2014.
- The company now expects fiscal year 2015 UGG brand revenues to increase approximately 14 percent over the twelve month period ended March 31, 2014, up from the previous guidance of 12 percent.
- The company expects fiscal year 2015 Teva brand revenues to increase low double digits over the twelve month period ended March 31, 2014.
- The company expects fiscal year 2015 Sanuk brand revenues to increase low double digits over the twelve month period ended March 31, 2014.
- Combined fiscal year 2015 net sales of the company’s other brands are expected to be approximately $82.0 million compared to $48.6 million for the twelve month period ended March 31, 2014.
- Fiscal year 2015 guidance assumes that the company’s effective tax rate will be approximately 29 percent.
Third Quarter Fiscal Year 2015 Outlook for the Three Month Period Ending December 31, 2014
- The company expects third quarter fiscal year 2015 revenues to increase approximately 10 percent over the three month period ended December 31, 2013, and expects third quarter fiscal year 2015 diluted earnings per share of approximately $4.46 compared to a diluted earnings per share of $4.04 reported for the three month period ended December 31, 2013.
Fourth Quarter Fiscal Year 2015 Outlook for the Three Month Period Ending March 31, 2015
- The company expects fourth quarter fiscal year 2015 revenues to increase approximately 10 percent over the three month period ended March 31, 2014, and expects fourth quarter fiscal year 2015 diluted earnings per share of approximately $0.15 compared to a diluted loss per share of $(0.08) reported for the three months
Fiscal Year Change
As previously announced, the company recently changed its fiscal year end to March 31 from December 31, effective as of March 31, 2014. Accordingly, the company’s fiscal year will run from April 1, 2014 through March 31, 2015. The financial results reported in this press release for the period ended September 30, 2014 relate to the company’s second fiscal quarter of the 2015 fiscal year.