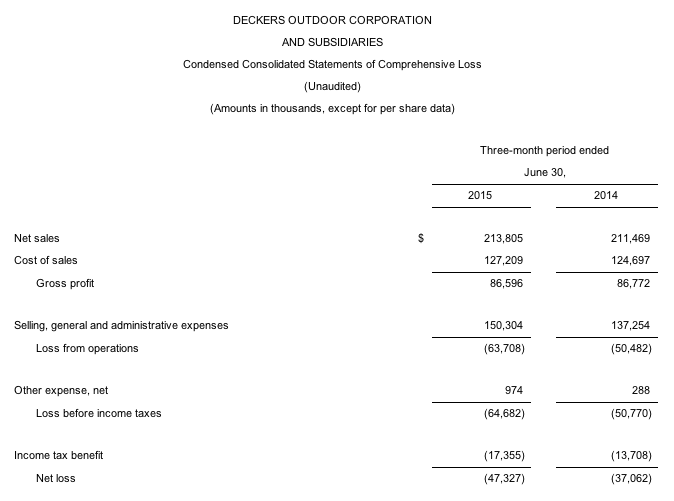
Deckers Brands reported sales increased 4.5 percent in its first quarter ended June 30, to $221 million on a currency-neutral basis, compared to $211.5 million for the same period last year. On a reported basis, net sales increased 1.1 percent.
Other highlights of the quarter include:
- Gross margin was 40.5 percent compared to 41.0 percent for the same period last year.
- SG&A expense as a percentage of sales was 70.3 percent compared to 64.9 percent for the same period last year.
- Diluted loss per share was $(1.43) compared to a diluted loss per share of $(1.07) for the same period last year.
“Our efforts to diversify our product lines, distribution channels and global revenue streams are creating a stronger foundation to support sustainable growth,” said Angel Martinez, CEO and chair of the board of directors. “At the same time, our enhanced omnichannel capabilities are giving us greater insight into our consumers, and are allowing us to deliver a full brand experiences across all touch points. Looking ahead, we believe our merchandise and marketing strategies have us well positioned for a successful fall/winter selling season which, combined with moderating expense growth and share repurchases, should generate increased value for our shareholders this year and beyond.”
Brand Summary
- UGG brand net sales for the first quarter decreased 7.2 percent to $114.5 million compared to $123.3 million for the same period last year, which was in line with expectations for the quarter. On a constant currency basis, sales decreased approximately 3.0 percent. The decrease in sales was driven by foreign currency pressure that caused a decrease in international distributor sales and a decrease in global Direct-to-Consumer sales, primarily due to lower tourist traffic, partially offset by an increase in global wholesale sales.
- Teva brand net sales for the first quarter increased 6.8 percent to $41.9 million compared to $39.3 million for the same period last year. On a constant currency basis, sales increased approximately 12.0 percent. The increase in sales was driven by an increase in global wholesale and distributor sales and global Direct-to-Consumer sales.
- Sanuk brand net sales for the first quarter decreased 7.0 percent to $33.5 million compared to $36.0 million for the same period last year, on both a reported and constant currency basis. The decrease in sales was driven by a decrease in global wholesale and distributor sales, partially offset by an increase in global Direct-to-Consumer sales.
- Combined net sales of the company's other brands increased 85.6 percent to $23.9 million compared to $12.9 million for the same period last year. The increase was primarily attributable to a $9.8 million increase in sales for the Hoke One One brand, compared to the same period last year.
- Wholesale and distributor sales for the first quarter decreased 0.4 percent to $153.4 million compared to $154.0 million for the same period last year. On a constant currency basis, sales increased approximately 2.2 percent. The decrease in sales was driven by a decrease in international wholesale and distributor sales, partially offset by an increase in domestic wholesale sales.
- Direct-to-Consumer sales for the first quarter increased 5.2 percent to $60.4 million compared to $57.5 million for the same period last year. On a constant currency basis, sales increased 10.5 percent. This increase was driven by 16 net new stores opened, as well as 3 new country specific e-commerce sites launched within the last year. Direct-to-Consumer comparable sales were flat over the same period last year.
- Domestic sales for the first quarter increased 1.7 percent to $134.5 million compared to $132.3 million for the same period last year.
- International sales for the first quarter increased 0.1 percent to $79.3 million compared to $79.2 million for the same period last year. On a constant currency basis, sales increased 9.1 percent to $86.5 million.
Gross Margins
Gross margin was 40.5 percent in the first quarter compared to 41.0 percent for the same period last year. The decline in gross margin was driven by an approximately 200 basis point impact from foreign exchange headwinds caused by the strengthening of the U.S. dollar versus the British pound, euro and yen compared to the same period last year. This decline was partially offset by a higher proportion of Direct-to-Consumer sales.
Stock Repurchase Program
During the first quarter of fiscal 2016, the company repurchased approximately 625,000 shares of its common stock at an average purchase price of $72.69, for a total of $45.4 million. As of June 30, 2015, the company had $126.7 million in authorized repurchase funds remaining under its $200.0 million stock repurchase program announced in January 2015.
Balance Sheet
At June 30, 2015, cash and cash equivalents were $168.7 million compared to $158.2 million at June 30, 2014. The company had $43.4 million in outstanding borrowings under its credit facility at June 30, 2015, compared to $3.2 million at June 30, 2014. The change in cash and cash equivalents and outstanding borrowings are primarily attributable to cash used for share repurchases and for purchases of capital expenditures, partially offset by cash provided by operations and proceeds from the loan on the corporate headquarters.
Inventories at June 30, 2015 increased 5.0 percent to $373.6 million compared to $356.0 million at June 30, 2014. By brand, at June 30, 2015, UGG inventory increased 1.0 percent to $307.3 million, Teva inventory increased 20.1 percent to $22.5 million, Sanuk inventory increased 11.4 percent to $17.9 million, and the other brands' inventory increased 54.2 percent to $25.9 million.
Full Fiscal 2016 Outlook for the Twelve Month Period Ending March 31, 2016
The company expects fiscal 2016 constant currency revenues to be approximately $2.01 billion, reflecting a 10.5 percent increase over the twelve month period ended March 31, 2015. On a reported basis, revenues are expected to be $1.96 billion, or an increase of 8.0 percent.
Gross profit margin for fiscal 2016 is expected to be approximately 48 percent, down 30 basis points from fiscal 2015, as a result of expectations regarding a stronger U.S. dollar, partially offset by lower input costs and favorable changes in the company's channel mix.
SG&A expense as a percentage of sales is projected to be approximately 35.8 percent, compared to 36.0 percent in fiscal 2015.
The company expects fiscal 2016 diluted earnings per share to be approximately $5.68 on a constant currency basis, reflecting an increase of 22 percent over the twelve month period ended March 31, 2015. On a reported basis, earnings per share are expected to be $5.15, or an increase of 10.5 percent. The increase in earnings per share from our initial outlook reflects a lower share count due to the shares repurchased in the first quarter fiscal 2016.
Outlook
The company expects second quarter fiscal 2016 constant currency revenues to be up approximately 5.0 percent over the same period last year and up approximately 1.0 percent on a reported basis. The company expects diluted earnings per share of approximately $1.05 on a reported basis compared to diluted earnings per share of $1.17 for the same period last year. On a constant currency basis, earnings per share are expected to be $1.41, which represents constant currency earnings growth of approximately 20 percent.
As a reminder, a significant amount of Deckers operating expenses are fixed and spread evenly on an absolute dollar basis throughout each quarter. The brand expects the majority of its earnings increase in fiscal 2016 to come in the third and fourth quarters.