Canada Goose Holdings Inc. reported third-quarter earnings catapulted 66.2 percent on a 50.2 percent revenue hike. Earnings came in well above Wall Street’s target. The company lifted its guidance for the year.
Third Quarter Fiscal 2019 Highlights (In Millions Of Canadian Dollars)
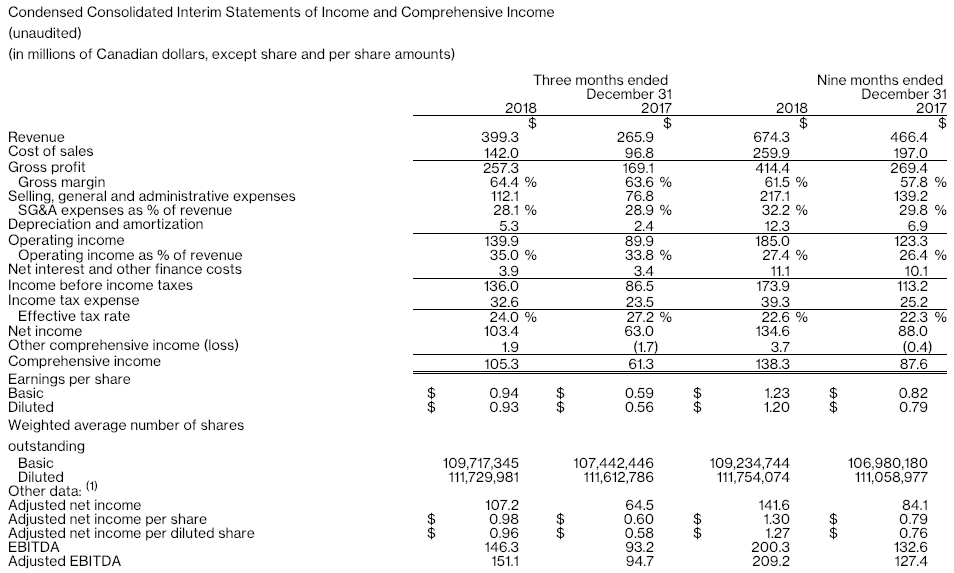
- Total revenue increased by 50.2 percent to $399.3m
- Net income per diluted share increased by 66.1 percent to 93 cents
- Adjusted EBITDA increased by 59.6 percent to $151.1m
- Adjusted net income per diluted share increased by 65.5 percent to 96 cents
“Fiscal 2019 is shaping up to be another year of impressive results. In our peak selling season we continued to deliver when and where it matters most, while also strengthening our foundation for future success on the global stage,” said Dani Reiss, President & CEO. “We have successfully entered new markets, introduced a new product, and increased capacity to meet growing demand in both channels. We remain deeply confident in the long runway we have ahead.”
Third Quarter Fiscal 2019 Results (in Canadian dollars, compared to Third Quarter Fiscal 2018):
- Total revenue increased by 50.2 percent to $399.3m from $265.9m, or 49.0 percent on a constant currency basis(1). Across our business, a higher proportion of customers purchased product earlier in the second half of fiscal 2019 relative to the same period last year, which positively impacted our growth in the quarter.
- DTC revenue increased to $235.3m from $131.7m. The increase was driven by incremental revenue from five new retail stores and one new e-commerce site, as well as the strong performance of existing retail stores and e-commerce sites.
- Wholesale revenue increased to $164.0m from $134.2m. The increase was primarily attributable to higher order values from existing partners, coupled with earlier shipment timing relative to last year. Favorable foreign exchange fluctuations and incremental revenue from the acquisition of the business of Baffin Inc. (“Baffin”) also contributed positively.
- Gross profit increased to $257.3m, a gross margin of 64.4 percent, compared to $169.1m, a gross margin of 63.6 percent. The increase in gross margin was driven by a greater proportion of DTC revenue.
- DTC gross profit was $179.0m, a gross margin of 76.1 percent, compared to $100.7m, a gross margin of 76.5 percent. The decrease in gross margin was due to sold inventory manufactured at higher labor costs due to the onset of Ontario’s minimum wage increase at the start of the 2018 calendar year.
- Wholesale gross profit was $78.3m, a gross margin of 47.7 percent, compared to $68.4m, a gross margin of 51.0 percent. The decrease in gross margin was due to changes in product mix, profits which would otherwise have been recognized on sold Baffin inventory due to a fair value markup at acquisition, and manufacturing labor cost increases, which had a more significant impact in the channel due to the difference between wholesale and retail selling prices. For the nine months ended December 31, wholesale gross margin was 49.2 percent compared to 48.2 percent during the same period last year.
- Operating income was $139.9m, compared to $89.9m. The increase in operating income was driven by revenue growth and gross margin expansion, partially offset by SG&A growth investments.
- Unallocated corporate expenses were $61.3m, compared to $44.0m. The increase was primarily due to investments to support growth in marketing, corporate headcount and IT, including Greater China operations. Professional fees and other costs relating to public company compliance also increased.
- Unallocated depreciation and amortization were $5.3m, compared to $2.4m, driven by the retail store opening program.
DTC operating income was $141.4m, an operating margin of 60.1 percent, compared to $79.1m, an operating margin of 60.0 percent. The benefit of strong sales productivity across the channel was partially offset by incremental SG&A fees to operating partners in Greater China.
Wholesale operating income was $65.1m, an operating margin of 39.7 percent, compared to $57.2m, an operating margin of 42.7 percent. The decrease in operating margin is attributable to the decline in wholesale gross margin described above, partially offset by lower SG&A as a percentage of sales. - Net income was $103.4m, or $0.93 per diluted share, compared to $63.0m, or $0.56 per diluted share. The increase in net income was due to higher operating income and a lower effective tax rate.
- Adjusted EBITDA was $151.1m, compared to $94.7m.
- Adjusted net income was $107.2m, or $0.96 per diluted share, compared to adjusted net income of $64.5m, or $0.58 per diluted share. Wall Street’s EPS target was 81 cents.
Revised Fiscal 2019 Outlook
Based on the strength of reported financial results for the nine months ended December 31, with significant contributions from both channels, as well as current trends in the business, the company has revised its outlook for fiscal 2019, which was previously provided with the release of second quarter fiscal 2019 results on November 14, 2018.
For fiscal 2019, the company currently expects:
- Annual revenue growth in the mid-to-high thirties on a percentage basis, compared to at least 30 percent
- Adjusted EBITDA margin(1) expansion of at least 150 basis points compared to fiscal 2018, unchanged
- Annual growth in adjusted net income per diluted share(1) in the mid-to-high forties on a percentage basis, compared to at least 40 percent
Key assumptions underlying the company’s fiscal 2019 outlook above are as follows:
- Wholesale revenue growth in the mid-to-high teens on a percentage basis, compared to high-single-digits, due to sales outperformance in the channel year-to-date
- SG&A growth investments in infrastructure and people including IT and the establishment of a country office in Greater China to lead market development efforts
- SG&A fees to operating partners on DTC sales in Greater China
- Capital expenditures of approximately $70 million including investments in new retail stores, IT and manufacturing capacity
- Weighted average diluted shares outstanding of 112.1 million
- Effective annual tax rate approximately in-line with fiscal 2018
Change in Fiscal Year-End
Effective as of fiscal 2020, the company’s fiscal year will end on the Sunday closest to March 31. Further details are included in Management’s Discussion and Analysis for the third quarter of fiscal 2019.