
Columbia Sportswear Company, parent company of the Columbia, Mountain Hardwear, Sorel and Prana brand businesses, saw sales return to growth mode in the 2024 fourth quarter and is busy planning for continued growth into 2025 and beyond. Still, COLM shares were down nearly 10 percent in overnight trading after the company reported Q4 and full year 2024 results on Tuesday afternoon. Analysts took a harder look on the company’s miss on the bottom line (7.3 percent below analysts’ consensus estimates) and a tepid outlook for 2025 first quarter sales growth that came in 3.5 percent below analysts’ estimates.
COLM shares closed down in the mid-single digits to end the day on Wednesday.
“I’m encouraged that sales returned to growth in the fourth quarter, and we expect continued growth in 2025, across most brands and regions,” commented company Chairman, President and CEO Tim Boyle in an initial release of results. “During the year we made substantial progress on our inventory reduction efforts, achieved cost savings through our Profit Improvement Program, and returned meaningful cash to shareholders through share buybacks and dividends. We also laid the foundation for Columbia’s Accerate Growth Strategy, which will come to life in the seasons ahead.”
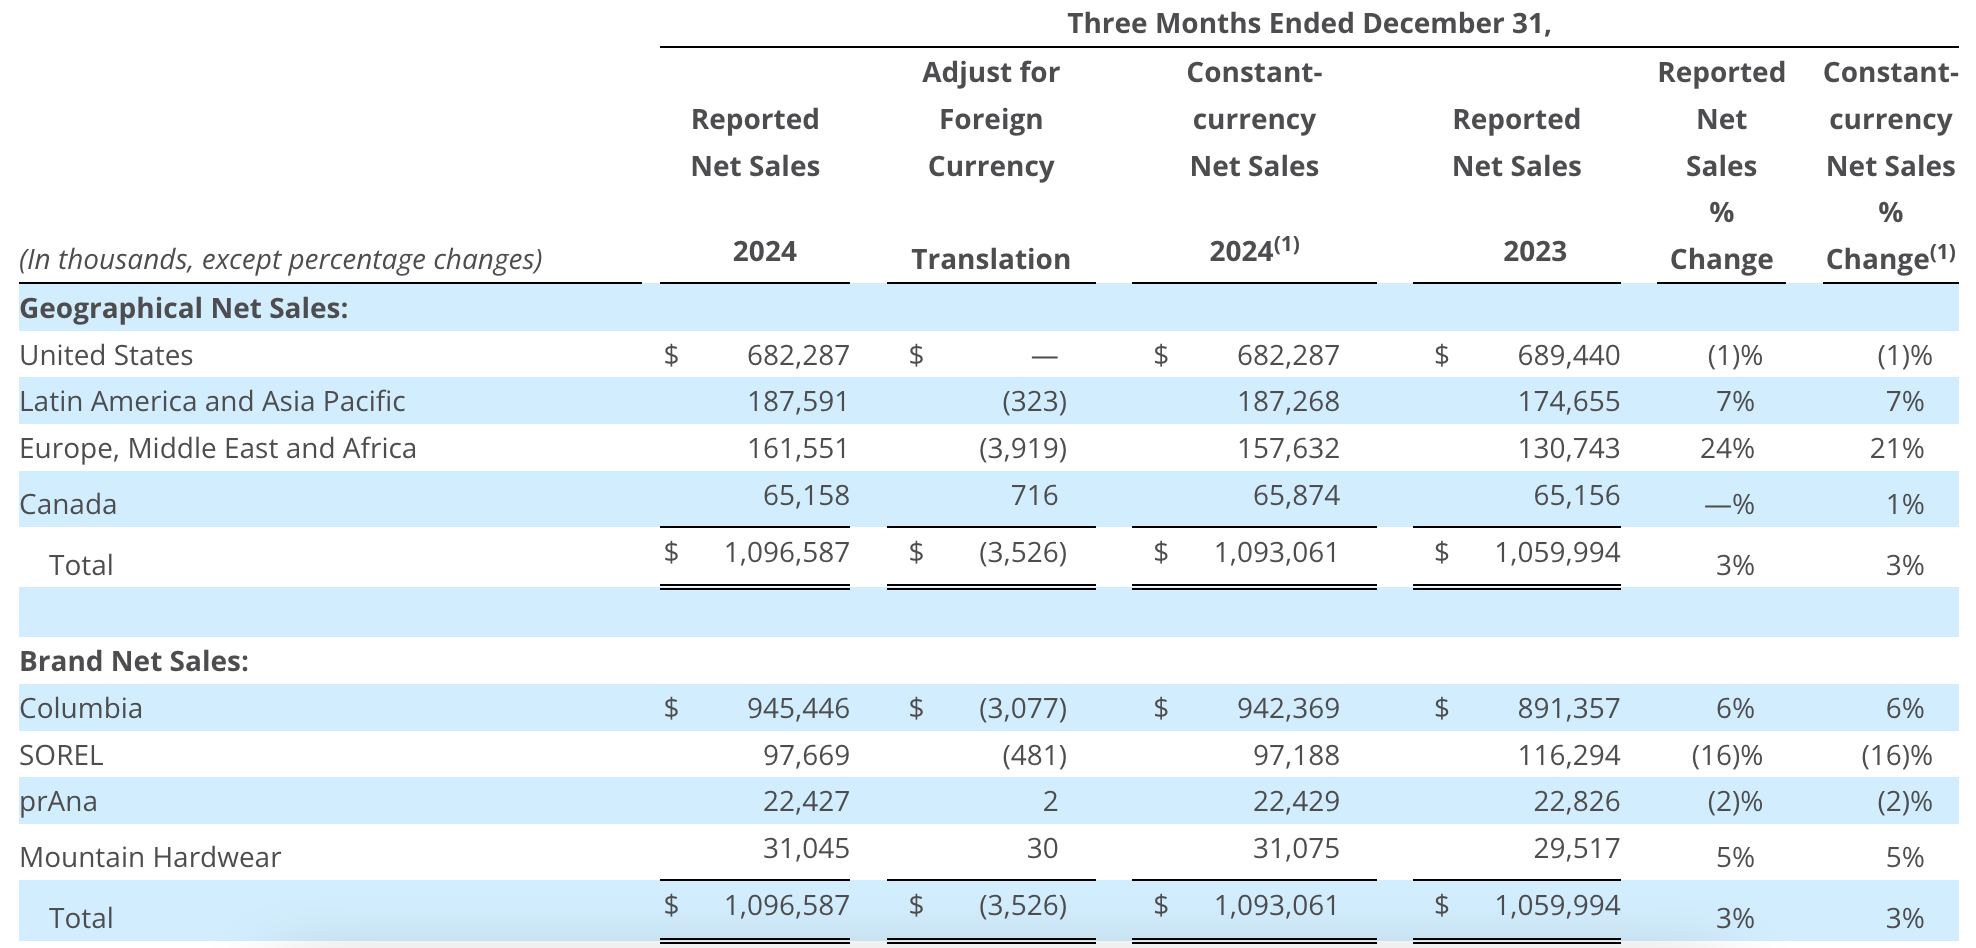
Net sales increased 3 percent to $1.10 billion in the fourth quarter from $1.06 billion in the comparable Q4 period in 2023. The increase was reportedly led by the Europe, Middle East and Africa (EMEA) and the Latin America, Asia Pacific (LAAP) regions, partially offset by the U.S. Canada was flat year-over-year.
Income Statement Summary
Gross margin expanded 50 basis points to 51.1 percent of net sales in Q4, compared to 50.6 percent of net sales for the comparable period in 2023. The company said gross margin expansion primarily reflects lower inventory clearance activity, partially offset by unfavorable FX hedging rates.
SG&A expenses were $430.6 million, or 39.3 percent of net sales, compared to $404.8 million, or 38.2 percent of net sales, for the comparable period in 2023. The largest changes in SG&A expenses were said to be higher incentive compensation and direct-to-consumer (DTC) expenses, partially offset by lower supply chain expenses.
There was no impairment of goodwill in fourth quarter 2024, compared to a $25.0 million charge related to prAna for the comparable period in 2023, which negatively impacted diluted earnings per share by $0.31.
Operating income increased 21 percent to $137.3 million, or 12.5 percent of net sales, compared to operating income of $113.1 million, or 10.7 percent of net sales, for the comparable period in 2023.
Interest income, net of $4.8 million, compared to $5.0 million for the comparable period in 2023.
Income tax expense of $37.3 million resulted in an effective income tax rate of 26.7 percent, compared to income tax expense of $26.6 million, or an effective income tax rate of 22.2 percent, for the comparable period in 2023. Fourth quarter 2024 income tax expense reportedly includes a $6.4 million discrete tax valuation allowance expense, which negatively impacted diluted earnings per share by $0.11.
Net income increased 10 percent to $102.6 million, or $1.80 per diluted share, in the fourth quarter, compared to net income of $93.3 million, or $1.55 per diluted share, for the comparable Q4 period in 2023.
Full Year 2024 Financial Results
- Net sales decreased 3 percent to $3.37 billion in 2024 from $3.49 billion in 2023.
- Gross margin expanded 60 basis points to 50.2 percent of net sales in 2024.
- SG&A expenses were $1.44 billion, or 42.9 percent of net sales, in 2024, compared to $1.42 billion, or 40.6 percent of net sales, in 2023.
- There was no impairment of goodwill in 2024, compared to a $25.0 million charge related to Prana in 2023.
- Operating income decreased 13 percent to $270.7 million, or 8.0 percent of net sales, in 2024, compared to operating income of $310.3 million, or 8.9 percent of net sales, in 2023.
- Interest income, net was $27.7 million in 2024, compared to $13.7 million in 2023.
- Income tax expense of $74.9 million resulted in an effective income tax rate of 25.1 percent, in 2024, compared to income tax expense of $74.8 million, or an effective income tax rate of 22.9 percent, in 2023.
- Net income decreased 11 percent to $223.3 million, or $3.82 per diluted share, in 2024, compared to net income of $251.4 million, or $4.09 per diluted share, in 2023.
Balance Sheet Summary
Cash, cash equivalents, and short-term investments totaled $815.5 million at year-end, compared to $764.5 million as of December 31, 2023.
The company had no borrowings as of either December 31, 2024 or December 31, 2023.
Inventories decreased 7 percent to $690.5 million at year-end 2024, compared to $746.3 million as of year-end 2023.
“Our balance sheet remains strong, with cash and short-term investments of approximately $815 million and no bank borrowings exiting the quarter,” Boyle noted.
Cash Flow Summary
Net cash provided by operating activities was $491.0 million in 2024, compared to net cash provided by operating activities of $636.3 million in 2023.
Capital expenditures totaled $59.8 million in 2024, compared to $54.6 million in 2023.
Share Repurchases for 2024
The company repurchased 3,962,540 shares of common stock for an aggregate of $317.8 million, or an average price per share of $80.19, in 2024.
At 2024 year-end, $627.6 million remained available under the company’s stock repurchase authorization, which does not obligate the company to acquire any specific number of shares or to acquire shares over any specified period of time.
Quarterly Cash Dividend
The Board of Directors approved a regular quarterly cash dividend of 30 cents per share, payable on March 21, 2025 to shareholders of record on March 10, 2025.
Full Year 2025 Financial Outlook
The company’s 2025 Financial Outlook is forward-looking in nature, and the following forward-looking statements reflect the company’s expectations as of February 4, 2025. This outlook and commentary does not include any potential impacts on the company as a result of the recent U.S. administration change, other than the direct costs of tariff actions announced on February 1, 2025, or actions the company may undertake as it reviews its cost structure and looks to expand the Profit Improvement Plan.
- Net sales are expected to increase 1.0 percent to 3.0 percent, resulting in net sales of $3.40 billion to $3.47 billion in 2025, compared to $3.37 billion in 2024.
- Gross margin is expected to expand 80 basis points to approximately 51 percent of net sales from 50.2 percent of net sales in 2024.
- SG&A expenses, as a percent of net sales, are expected to be 43.4 percent to 44.1 percent, compared to SG&A expense as a percent of net sales of 42.9 percent in 2024.
- Operating margin is expected to be 7.7 percent to 8.3 percent, compared to operating margin of 8.0 percent in 2024.
- Effective income tax rate is expected to be 24.0 to 25.0 percent.
- Diluted earnings per share is expected to be $3.80 to $4.15, compared to $3.82 in 2024.
- Operating cash flow is expected to be at least $250 million.
- Capital expenditures are planned to be in the range of $60 to $80 million.
First Half (H1) 2025 Financial Outlook
- Net sales are expected to be $1.35 billion to $1.38 billion in H1 2025, representing an increase of 1 percent to 3 percent from $1,34 million for the comparable period in 2024.
- Operating margin is expected to be 1.5 percent to 2.2 percent, compared to operating margin of 1.6 percent in the comparable period in 2024.
- Diluted earnings per share is expected to be 43 cents to 56 cents per diluted share in H1 2025, compared to 51 cents for the comparable H1 period in 2024.
First Quarter (Q1) 2025 Financial Outlook
- Net sales are expected to range between $749 million and $764 million in Q1 2025, representing a decline of 3 percent to 1 percent from $770 million for the comparable Q1 period in 2024.
- Operating margin is expected to be 5.4 percent to 6.0 percent of net sales, compared to operating margin of 5.8 percent in the comparable Q1 period in 2024.
- Diluted earnings per share is expected to be 62 cents to 70 cents per diluted share in Q1, compared to 71 cents per diluted share in Q1 2024.
Image courtesy Columbia Sportswear Company