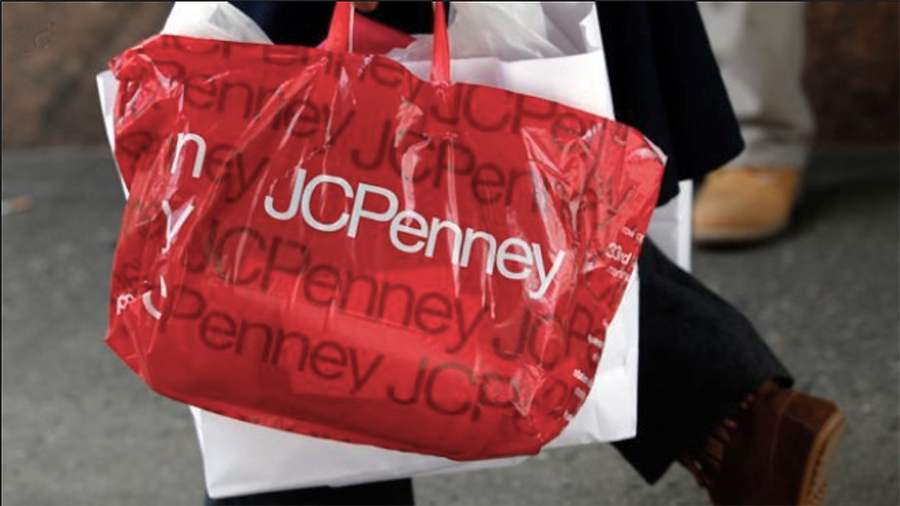
J. C. Penney Company reported earnings on an adjusted basis fell 24.6 percent in the fourth quarter as same-store sales were down 7.0 percent.
“In Fiscal 2019, we met or exceeded all five financial guidance metrics for the year, and we delivered our third consecutive quarter of meaningful gross-margin improvement in the fourth quarter,” said Jill Soltau, chief executive officer of JCPenney. “I am encouraged by our progress, especially in our women’s apparel businesses. We knew it would take time to restore discipline and return growth to JCPenney. As we move into Fiscal 2020, we remain focused on the key tenets of retail as we continue rebuilding the company and implementing our Plan for Renewal.”
Total net sales for the 2019 fourth quarter decreased 7.7 percent to $3.38 billion compared to $3.67 billion for the fourth quarter last year.
Adjusted comparable store sales, which exclude the impact of the company’s exit from major appliance and in-store furniture categories, decreased 4.7 percent for the quarter. Credit income was $109 million for the fourth quarter this year compared to $121 million in the fourth quarter last year.
Cost of goods sold, which excludes depreciation and amortization, was $2.26 billion, or 66.7 percent of net sales, in the fourth quarter this year compared to $2.52 billion, or 68.7 percent of net sales, in the same period last year. The 200-basis point improvement as a rate of net sales was primarily driven by improved enterprise clearance selling margins from lower permanent markdowns, the exit from the major appliance and in-store furniture categories earlier this year and improved shrink results.
SG&A expenses for the quarter were $1.01 billion, or 29.7 percent of net sales, this year compared to $1.01 billion, or 27.5 percent of net sales, last year. While SG&A dollars were flat to last year, lower advertising and store controllable expenses helped offset higher incentive compensation. Additionally, in connection with the adoption of the new Lease Accounting Standard at the beginning of fiscal 2019, SG&A expenses in the fourth quarter this year included approximately $5 million related to the company’s home office lease. Last year, the home office lease-related expense was recorded as elements of depreciation and amortization and interest expense.
Net income for the fourth quarter was $27 million, or 8 cents per share, compared to net income of $75 million, or 24 cents per share, in the same period last year.
Adjusted net income was $43 million, or 13 cents per share, this year compared to adjusted net income of $57 million, or 18 cents per share, last year.
Full Year 2019 Results
The following financial results reflect the 52 weeks ended February 1, 2020 for fiscal 2019 and February 2, 2019 for fiscal 2018.
For fiscal 2019, total net sales decreased 8.1 percent to $10.72 billion compared to $11.66 billion for fiscal 2018. Comparable store sales decreased 7.7 percent for the year. Adjusted comparable store sales, which exclude the impact of the company’s exit from major appliance and in-store furniture categories, decreased 5.6 percent for the year. Credit income was $451 million this year compared to $355 million last year.
Cost of goods sold, which excludes depreciation and amortization, was $7.01 billion, or 65.4 percent of net sales, this year compared to $7.87 billion, or 67.5 percent of net sales, last year. The 210-basis point improvement, as a rate of net sales, was primarily driven by an increase in both store and online selling margins, improved shrink results and the exit from the major appliance and in-store furniture categories earlier this year.
SG&A expenses for the year were $3.59 billion, or 33.5 percent of net sales, this year compared to $3.60 billion, or 30.8 percent of net sales, last year. The decrease in SG&A dollars this year was primarily due to lower advertising and store controllable expenses, which were offset by slightly higher incentive compensation. Last year, the company recorded an approximate $70 million benefit in SG&A expenses primarily related to the buyout of two store leasehold interests. Additionally, in connection with the adoption of the new Lease Accounting Standard at the beginning of fiscal 2019, SG&A expenses this year included approximately $20 million related to the company’s home office lease. Last year, the home office lease-related expense was recorded as elements of depreciation and amortization and interest expense.
For the year, the company’s net loss was $268 million, or ($0.84) per share, compared to a net loss of $255 million, or ($0.81) per share, last year.
Adjusted net loss improved to $257 million, or ($0.80) per share, this year compared to an adjusted net loss of $296 million, or ($0.94) per share, last year.
Cash and cash equivalents at the end of fiscal 2019 were $386 million. Free cash flow was $145 million for fiscal 2019, an increase of $34 million compared to the same period last year.
Inventory at the end of the fiscal year was $2.17 billion, down 11.1 percent compared to the end of fiscal 2018 and down 22.7 percent when compared to the end of fiscal 2017.
The company ended fiscal 2019 with liquidity of approximately $1.8 billion.
2020 Store Closures Update
The company expects to close at least six store locations in fiscal 2020. The company will share more details of future real estate plans during its Analyst Day on April 7, 2020.
2020 Financial Guidance
The company has provided financial guidance for full-year fiscal 2020, which does not include any potential impact from the current coronavirus (COVID-19) situation, as follows:
- Comparable store sales expected to be in a range of (3.5) percent to (4.5) percent;
- Cost of goods sold, as a rate of net sales: expected to improve 100 to 130 basis points compared to last year;
- Adjusted EBITD1 dollars expected to increase 5 percent to 10 percent compared to last year; and
- Free Cash Flow expected to be positive.


