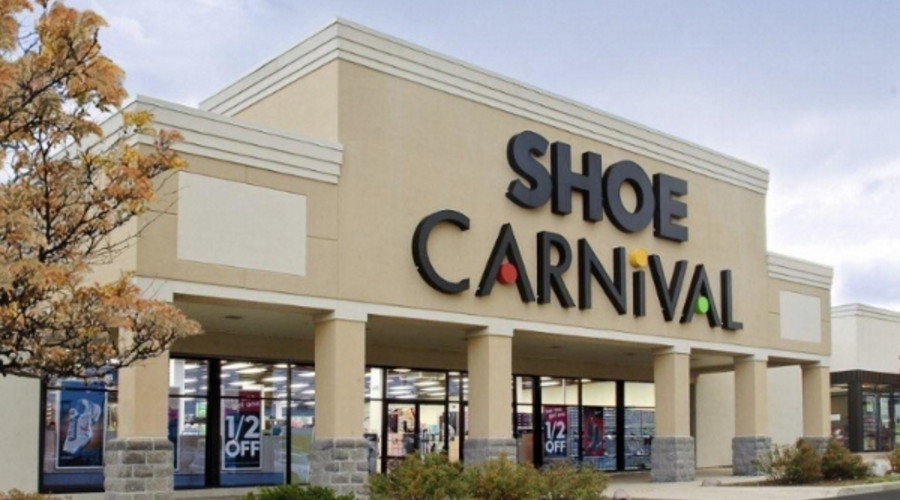
Shoe Carnival Inc. reported a slight decline in earnings in the second quarter on flattish comp sales. The off-price chain said it was impacted by later back-to-school dates in certain markets.
Second Quarter Highlights
- Net sales increased 1.4 percent to $235.1 million
- Comparable store sales increased 0.4 percent
- Earnings per diluted share increased 9.1 percent to 24 cents
- Repurchased 469,000 shares of common stock at a total cost of $10.2 million under existing share repurchase program
Cliff Sifford, Shoe Carnival’s president and chief executive officer, commented, “We are pleased with the quarterly improvement in our sales trend, particularly given this year’s later back-to-school dates in certain markets, which shifted sales from July into August. Our quarterly earnings were driven by the increase in sales along with our ability to efficiently manage our expenses. Looking ahead, we believe we are well positioned for back-to-school with a trend-right assortment of branded, family footwear, favorable inventory position, and our multi-channel initiatives which have already generated an August comparable store sales increase of 7 percent. Our team remains focused on enhancing value for shareholders through our recently increased quarterly cash dividend and existing share repurchase program, in addition to improved execution in a challenging retail environment.”
Second Quarter Financial Results
The company reported net sales of $235.1 million for the second quarter of fiscal 2017, a 1.4 percent increase, compared to net sales of $231.9 million for the second quarter of fiscal 2016. Comparable store sales increased 0.4 percent in the second quarter of fiscal 2017.
Gross profit margin for the second quarter of fiscal 2017 remained flat at 29 percent compared to the second quarter of fiscal 2016. Merchandise margin, along with buying, distribution and occupancy expenses as a percentage of net sales, remained flat compared to the second quarter of fiscal 2016.
Selling, general and administrative expenses (SG&A) for the second quarter of fiscal 2017 increased $1.2 million to $61.8 million. As a percentage of net sales, these expenses increased to 26.3 percent compared to 26.1 percent in the second quarter of fiscal 2016.
Net income for the second quarter of fiscal 2017 was $3.9 million, or 24 cents per diluted share. For the second quarter of fiscal 2016, the company reported net income of $4.1 million, or 22 cents per diluted share.
Six Month Financial Results
Net sales during the first six months of fiscal 2017 decreased $3.9 million to $488.5 million compared to the same period last year. Comparable store sales for the twenty-six week period ended July 29, 2017, decreased 1.9 percent.
Net earnings for the first six months of fiscal 2017 were $12.1 million, or 73 cents per diluted share, compared to net earnings of $14.8 million, or 78 cents per diluted share, in the first six months of fiscal 2016. The gross profit margin for the first six months of fiscal 2017 was 28.7 percent compared to 29 percent in the same period last year. SG&A for the first six months increased $1.9 million to $120.7 million. As a percentage of net sales, these expenses increased to 24.7 percent compared to 24.1 percent in the first six months of fiscal 2016. The company opened 12 stores and closed nine stores during the first six months of fiscal 2017 compared to 12 store openings and four store closings in the first six months of fiscal 2016.
Store Openings And Closings
The company expects to open approximately 19 stores and close approximately 25 to 27 stores during fiscal 2017 compared to opening 19 stores and closing nine stores during fiscal 2016.
Fiscal 2017 Earnings Outlook
The company expects fiscal 2017 net sales to be in the range of $1.006 billion to $1.019 billion, with comparable store sales flat to down low single digits. Earnings per diluted share for the fiscal year are expected to be in the range of $1.35 to $1.45. Fiscal 2016 earnings per diluted share were $1.28 and adjusted earnings per diluted share were $1.40.


