Brunswick Corp. reported earnings rose 32 percent on an adjusted basis in the fourth quarter. Sales grew 5.7 percent as a 18.6 percent gain in the marine segment offset a 5.6 percent decline in the fitness segment.
“Our combined marine portfolio had a fantastic 2018, which led to the company’s ninth consecutive year of adjusted EPS growth,” said Brunswick Chief Executive Officer David Foulkes. “The financial results demonstrate the outstanding execution of our marine strategy, where our focus on product and technology leadership, along with capacity investments and operational excellence, generated strong improvements. We leveraged our successful performance in a steady marine market into significant top-line growth, margin expansion, and record earnings,” Foulkes continued.
“In the fourth quarter, Mercury’s propulsion business continued to excel behind powerful demand for new outboard products, which generated 20 percent revenue growth in the quarter. The parts and accessories business, which was augmented by the first full quarter of results from the Power Products acquisition, also delivered impressive topline and earnings growth. In addition, the boat business achieved solid earnings improvements, led by healthy growth in Boston Whaler, Harris pontoons, and Sea Ray Sport Boats and Cruisers. Finally, our Fitness business continues to work through the separation process, and reported top-line and gross margin outcomes relatively consistent with our expectations for the quarter,” Foulkes continued.
“As I step into my new role as CEO, I am looking forward to executing against our strategic objectives and leading the company and our over 15,000 dedicated employees to even greater success in 2019 and beyond,” Foulkes concluded.
Presentation of Sea Ray Sport Yacht and Yacht Results
As a result of the June 25, 2018 announcement regarding Sea Ray, the results of the entire Sea Ray business are again being reported in continuing operations for GAAP purposes. However, as adjusted, non-GAAP results exclude the Sea Ray Sport Yacht and Yacht operations that are being wound down. Therefore, for all periods presented in this release, all figures and outlook statements incorporate these changes unless otherwise noted. For more information, please see the Form 8-K dated July 19, 2018, which includes metrics on a GAAP and as adjusted basis reflecting these changes.
2018 Full-Year Results
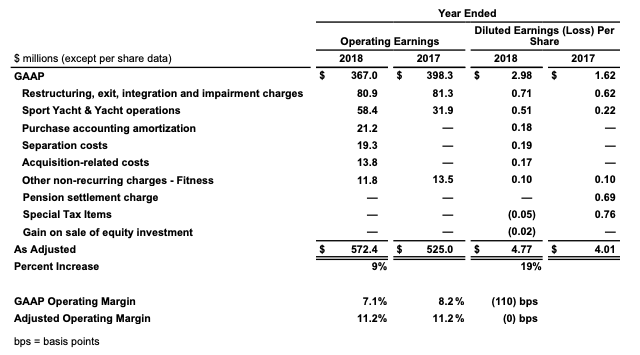
For the year ended Dec. 31, 2018, Brunswick reported net sales of $5,159.2 million, up from $4,835.9 million a year earlier, with $49.4 million and $151.6 million of sales related to Sport Yacht and Yacht operations in 2018 and 2017, respectively. Diluted EPS in 2018 was $2.98 on a GAAP basis versus $4.77 on an as adjusted basis.
Comparative full-year earnings results, including reconciliations of GAAP to as adjusted amounts, are shown below:
2018 Fourth Quarter Results
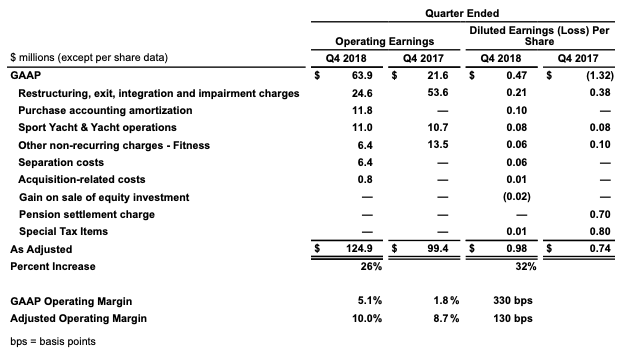
For the fourth quarter of 2018, Brunswick reported net sales of $1,248.9 million, up from $1,182.1 million a year earlier, with $5.4 million and $38.3 million of sales related to Sport Yacht and Yacht operations in the fourth quarter of 2018 and 2017, respectively. Diluted EPS for the quarter was $0.47 on a GAAP basis versus $0.98 on an as adjusted basis. Comparative fourth quarter earnings results, including reconciliations of GAAP to as adjusted amounts, are shown below:
Review of Cash Flow and Balance Sheet
Cash and marketable securities totaled $304.2 million at the end of 2018, down $154.8 million from year-end 2017 levels. The reduction includes net cash provided by operating activities during the year of $337.0 million, which decreased by $64.6 million versus the prior year, primarily due to planned increases in pension contributions, partially offset by lower tax payments. Free cash flow was $208.8 million in 2018. In addition, investing and financing activities resulted in a net cash usage of $486.8
million during 2018, which lowered cash and marketable securities balances.
Investing and financing activities during the year-to-date period included a $909.6 million expenditure for the Power Products acquisition, $793.5 million of net proceeds for issuances of debt related to the acquisition, $193.4 million of capital expenditures, $75.0 million of common stock repurchases, and $67.8 million of dividend payments.
Marine Engine Segment
The Marine Engine segment, which manufactures and distributes marine propulsion systems and related parts and accessories, reported net sales of $669.5 million in the fourth quarter of 2018, up 18.6 percent from $564.6 million in the fourth quarter of 2017. The Power Products acquisition contributed approximately 9 percent to the growth rate in the quarter. International sales, which represented 31 percent of total segment sales in the quarter, were up 18 percent compared to the prior year period. For the quarter, the Marine Engine segment reported operating earnings of $81.5 million, which included $11.8 million of purchase accounting amortization and $0.8 million of transaction costs, each related to the Power Products acquisition. This compares with $59.2 million of operating earnings in the fourth quarter of 2017.
Significant growth in both the outboard engine and parts and accessories businesses, including the results of the recent Power Products acquisition, drove sales increases in the quarter. Operating earnings growth was positively affected by these sales increases, as well as favorable impacts from changes in sales mix and new products.
Boat Segment
The Boat segment, which manufactures and distributes recreational boats, reported net sales of $377.3 million for the fourth quarter of 2018, a decrease from $386.5 million in the fourth quarter of 2017. Net sales included $5.4 million and $38.3 million of Sport Yacht and Yacht sales in the fourth quarter of 2018 and 2017, respectively.
International sales, which represented 20 percent of total segment sales in the quarter, decreased by 24 percent compared to the prior year, primarily due to lower sales into Canada due to the impact of retaliatory tariffs on wholesale shipments. For the fourth
quarter of 2018, the Boat segment reported operating earnings of $10.3 million, which included $8.6 million of restructuring, exit, integration, and impairment charges, as well as additional losses in excess of restructuring charges of $11.0 million related to the Sport Yacht and Yacht operations. This compares to operating losses of $22.7 million in the fourth quarter of 2017 which included $36.9 million of restructuring, exit, integration, and impairment charges and $10.7 million of operating losses, each related to Sport Yachts and Yachts.
The Boat segment’s quarterly operating earnings showed meaningful improvement reflecting benefits from higher net sales, with growth at Boston Whaler, Harris pontoons, and Sea Ray Sport Boats and Cruisers. The segment’s revenue and earnings comparisons were influenced by the results of Sport Yacht and Yacht operations noted above.
Fitness Segment
The Fitness segment, which manufactures and distributes cardiovascular and strength fitness equipment and active recreation products, reported net sales in the fourth quarter of 2018 of $287.7 million, a decrease from $304.8 million in the fourth quarter of 2017. International sales, which represented 49 percent of total segment sales in the quarter, increased 1 percent when compared to the fourth quarter of 2017. For the quarter, the Fitness segment reported operating losses of $2.7 million, which included restructuring, exit, integration, and impairment charges of $15.2 million, substantially all of which relates to a further impairment of the Cybex trade name, $6.4 million of charges related to other non-recurring items, and $2.2 million of separation costs. This compares with operating earnings of $7.9 million in the fourth quarter of 2017, which included $16.7 million of restructuring, exit, integration, and impairment charges, and a $13.5 million charge related to other non-recurring items.
The Fitness segment’s revenue comparisons reflected lower sales to value-oriented health clubs as anticipated. The decline in operating earnings resulted from the nonrecurring items discussed above, along with other operating factors including an unfavorable impact from changes in sales mix, additional inventory cost adjustments primarily related to product transitions, increased freight costs, and other cost inflation and inefficiencies.
2019 Outlook
“We are diligently executing against our marine strategy, and expect the operational, strategic, and growth advancements achieved by our marine business to lead us to greater success in 2019,” said Foulkes. “With the pending separation of the Fitness segment, we are providing additional outlook comments and guidance for the company exclusive of the Fitness business. This presentation provides increased visibility into the expectations for the performance of the marine operations and will minimize
adjustments to our outlook at separation.
“In our combined marine business, we expect top-line performance to benefit from a steady global marine market, along with ongoing benefits from customer migration to higher horsepower engines and boats with increased technology and content. In
addition, we anticipate market share gains due in part to the continued strong demand and acceptance of new outboard products. The parts and accessories business will also continue to bolster its healthy aftermarket business, while investing in expanding product categories, such as controls, rigging and electrical systems, to increase sales to boat manufacturers. As a result, absent significant changes in the global macroeconomic climate, our plan reflects overall revenue growth rates in 2019 in the range of 9 to 11 percent, including an approximate 4 percent benefit from completed acquisitions.
“For the full-year, we anticipate strong improvement in both gross and operating margins in our combined marine business, given ongoing benefits from new products and acquisitions, volume leverage, and cost reduction activities. Operating expenses are estimated to decline slightly versus 2018 on a percentage of sales basis. Operating earnings for the marine business are expected to grow by a high-teens percent for the year.
“For 2019, we expect Fitness net sales to decline mid-single digit percent from 2018 levels, reflecting lower sales to value-oriented health clubs and stable market demand. While we anticipate gross margin levels to remain consistent with 2018 levels, the plan
reflects operating margin declines due to planned investments in new products and modernizing information technology platforms, offset by certain cost reduction initiatives, which are intended to position the Fitness business to succeed as an independent entity.
“Given the factors discussed above, our guidance for 2019 as adjusted diluted EPS, excluding the Fitness business, is in the range of $4.50 to $4.70, which compares to a 2018 result of $4.13 on a similar, marine-only basis. Inclusive of the estimated full-year results of the Fitness business, our guidance for 2019 as adjusted diluted EPS is in the range of $4.80 to $5.05,” Foulkes concluded.
Brunswick’s brands include Mercury and Mariner outboard engines; Mercury MerCruiser sterndrives and inboard engines; MotorGuide trolling motors; Ancor, Attwood, BEP, Blue Sea Systems, Czone, Del City, Garelick, Lenco Marine, Marinco, Mastervolt, Mercury, NAUTIC-ON, Park Power, Progressive Industries, ProMariner, Quicksilver and Whale marine parts and accessories; Land ‘N’ Sea, Kellogg Marine, Lankhorst Taselaar, Payne’s Marine and BLA parts and accessories distributors; Bayliner, Boston Whaler, Brunswick Commercial and Government Products, Crestliner, Cypress Cay, Harris, Lowe, Lund, Princecraft, Quicksilver, Rayglass, Sea Ray, Thunder Jet and Uttern boats; Life Fitness, Hammer Strength, Cybex, Indoor Cycling Group and SCIFIT fitness equipment; and Brunswick billiards tables, accessories and game room furniture.