Yeti Holdings Inc. reported earnings on an adjusted basis increased 29 percent on a 17 percent sales gain. The company lifted its guidance for the year.
Matt Reintjes, president and chief executive officer, commented, “Yeti had a great quarter. Third quarter results were powered by a strong new product lineup and expanding gross margins – both powerful indicators of brand health and momentum. Supported by our four strategic growth drivers, we are increasing our full year outlook and are set up for a strong finish to 2019.”
For the Three Months Ended September 28, 2019
Net sales increased 17 percent to $229.1 million, compared to $196.1 million during the same period last year.
Direct-to-consumer (“DTC”) channel net sales increased 31 percent to $92.9 million, compared to $71.2 million in the prior year quarter, led by strong performance in both product categories, particularly in Drinkware.
Wholesale channel net sales increased 9 percent to $136.2 million, compared to $125.0 million in the same period last year, driven by strong performance in both Coolers & Equipment and Drinkware categories.
Drinkware net sales increased 21 percent to $126.4 million, compared to $104.0 million in the prior year quarter, primarily driven by the continued expansion of our product offerings, including the introduction of new colorways and sizes, and strong demand for customization.
Coolers & Equipment net sales increased 13 percent to $97.8 million, compared to $86.7 million in the same period last year, primarily driven by strong performance in soft coolers and outdoor living.
Gross profit increased 23 percent to $120.1 million, or 52.4 percent of net sales, compared to $97.5 million, or 49.7 percent of net sales, in the third quarter of 2018. The 270 basis point increase in gross margin was primarily driven by cost improvements, particularly in our Drinkware category and a favorable shift in our channel mix led by an increase in DTC channel net sales, partially offset by higher tariff rates.
Selling, general, and administrative (“SG&A”) expenses increased to $86.1 million, or 37.6 percent of net sales, compared to $69.4 million, or 35.4 percent of net sales, in the third quarter of 2018. SG&A as a percent of net sales increased 220 basis points, including approximately 100 basis points attributable to costs incurred in our ongoing transition to a public company. The balance, or approximately 120 basis points, was primarily due to higher variable selling expenses driven by our faster growing DTC channel, increased marketing expenses, and increased personnel to support long-term growth in our business, partially offset by lower non-cash stock-based compensation expense, and professional fees.
Operating income increased 21 percent to $34.0 million, to 14.8 percent of net sales, compared to $28.1 million, or 14.3 percent of net sales, during the prior year quarter.
Adjusted operating income increased 27 percent to $40.4 million, to 17.6 percent of net sales, compared to $31.7 million, or 16.2 percent of net sales, during the same period last year.
Net income increased 25 percent to $21.3 million, compared to $17.0 million in the prior year quarter; earnings per diluted share increased 20 percent to $0.25, compared to $0.21 per diluted share in the prior year quarter.
Adjusted net income increased 29 percent to $26.1 million, compared to $20.2 million in the prior year quarter; adjusted earnings per diluted share increased 24 percent to $0.30, compared to $0.24 per diluted share in the prior year quarter.
Adjusted EBITDA increased 24 percent to $47.5 million, or 20.7 percent of net sales, from $38.4 million, or 19.6 percent of net sales, during the same period last year.
For the Nine Months Ended September 28, 2019
Net sales increased 15 percent to $616.1 million, compared to $537.7 million during the same period last year.
Direct-to-consumer (“DTC”) channel net sales increased 34 percent to $237.2 million, compared to $176.9 million in the prior year period, led by strong performance in both Coolers & Equipment and Drinkware categories.
Wholesale channel net sales increased 5 percent to $379.0 million, compared to $360.7 million in the same period last year, primarily driven by Coolers & Equipment.
Drinkware net sales increased 19 percent to $334.3 million, compared to $280.7 million in the prior year period, primarily driven by the continued expansion of our Drinkware product offerings, including the introduction of new colorways, sizes, and accessories, and strong demand for customization.
Coolers & Equipment net sales increased 11 percent to $266.6 million, compared to $240.0 million in the same period last year, primarily driven by strong performance in outdoor living products, bags, hard coolers, soft coolers, and cargo, as well as the introduction of the Camino Carryall to our wholesale channel during the first quarter of 2019.
Gross profit increased 23 percent to $313.0 million, or 50.8 percent of net sales, compared to $255.3 million, or 47.5 percent of net sales, in the prior year period. The 330 basis point increase in gross margin was primarily driven by cost improvements, particularly in our Drinkware category, a favorable shift in our channel mix led by an increase in DTC channel net sales, and lower inbound freight, partially offset by higher tariff rates and the unfavorable impact of inventory reserve reductions in the prior year period.
Selling, general, and administrative (“SG&A”) expenses increased to $235.2 million, or 38.2 percent of net sales, compared to $190.7 million, or 35.5 percent of net sales, in the same period last year. SG&A as a percent of net sales increased 270 basis points, including approximately 90 basis points attributable to costs incurred in our ongoing transition to a public company. The balance, or approximately 180 basis points, was primarily due to higher variable selling expenses driven by our faster growing DTC channel, increased marketing expenses, and increased personnel to support growth in our business, partially offset by lower third-party logistics fees, lower non-cash stock-based compensation expense, and other general and administrative cost savings.
Operating income increased 21 percent to $77.8 million, to 12.6 percent of net sales, compared to $64.6 million, or 12.0 percent of net sales, during the prior year period.
Adjusted operating income increased 26 percent to $98.5 million, to 16.0 percent of net sales, compared to $78.3 million, or 14.6 percent of net sales, during the same period last year.
Net income increased 40 percent to $45.7 million, compared to $32.6 million in the prior year period; earnings per diluted share increased 35 percent to $0.53, compared to $0.39 per diluted share in the prior year period.
Adjusted net income increased 40 percent to $61.3 million, compared to $43.6 million in the prior year period; adjusted earnings per diluted share increased 35 percent to $0.71, compared $0.53 per diluted share in the same period last year.
Adjusted EBITDA increased 23 percent to $119.5 million, or 19.4 percent of net sales, from $96.8 million, or 18.0 percent of net sales, during the prior year period.
Balance Sheet and Cash Flow Highlights
Inventory increased 33 percent to $209.2 million, compared to $157.7 million at the end of the third quarter of 2018.
Inventory levels reflect the strategic buildup of Drinkware in advance of potential additional tariffs as well as investments to support anticipated sales growth. Excluding the Drinkware buildup, inventory growth was slightly below our reported sales growth for the quarter.
Total debt, excluding unamortized deferred financing fees, was $298.0 million, compared to $394.0 million at the end of the third quarter of 2018. During the first nine months of 2019, we made $34.9 million in debt payments. Our ratio of net debt to adjusted EBITDA for the trailing twelve months was 1.5 times at the end of the third quarter of 2019 compared to 2.6 times at the end of the same period last year.
Cash flow provided by operating activities was $26.6 million and capital expenditures were $24.2 million for the nine months ended September 28, 2019.
Updated 2019 Full Year Outlook
- Net sales are now expected to increase between 14.5 percent and 15.0 percent compared to 2018, with growth across both channels and led by the DTC channel (versus the previous outlook of between 13.5 percent and 14.0 percent);
- Operating income as a percentage of net sales is now expected to be between 14.0 percent and 14.2 percent (versus the previous outlook of 13.9 percent to 14.1 percent), reflecting margin expansion of 90 to 110 basis points, primarily driven by higher gross margin;
- Adjusted operating income as a percentage of net sales is now expected to be between 16.8 percent and 17.0 percent (versus the previous outlook of 16.3 percent to 16.6 percent), reflecting margin expansion of 90 to 110 basis points, primarily driven by higher gross margin;
- An effective tax rate at a more normalized level of approximately 24.5 percent, which remains unchanged from the previous outlook;
- Net income per diluted share is now expected to be between $0.90 and $0.92, reflecting 29 percent to 33 percent growth (versus the previous outlook of $0.88 to $0.90); assuming a normalized tax rate of 24.5 percent in 2018 (the effective tax rate for 2018 was 17 percent), earnings growth would be between 42 percent to 46 percent;
- Adjusted net income per diluted share is now expected to be between $1.12 and $1.14, reflecting 23 percent to 26 percent growth (versus the previous outlook of $1.07 and $1.09, reflecting 18 percent to 21 percent growth); assuming a normalized tax rate of 24.5 percent in 2018 (the effective tax rate for 2018 was 17 percent), adjusted earnings growth would be between 33 percent and 36 percent (versus the previous outlook of 27 percent to 30 percent);
- Diluted weighted average shares outstanding of 86.3 million (versus the previous outlook of 86.0 million);
- Adjusted EBITDA is now expected to be between $178.2 million and $181.2 million, or between 20.0 percent and 20.2 percent of net sales, reflecting 20 percent to 22 percent growth (versus the previous outlook of $174.8 million and $177.7 million, or between 19.8 percent and 20.0 percent of net sales, and reflecting growth of 17 percent to 19 percent);
- Capital expenditures are now expected to be between $30 million and $35 million; and
- Ratio of net debt to Adjusted EBITDA is expected to be approximately 1.0 times at the end of 2019, which remains unchanged from the previous outlook, compared to 1.7 times at the end of 2018.
Ratio of Net Debt to Adjusted EBITDA Trailing Twelve Months
- Net debt as of September 28, 2019, which is total debt of $298.0 million less cash of $34.6 million, divided by adjusted EBITDA for the trailing twelve months, was 1.5 times. Adjusted EBITDA for the trailing twelve months ending September 28, 2019 was $171.7 million and is calculated using the full year 2018 adjusted EBITDA of $149.0 million less adjusted EBITDA for the first nine months of 2018 of $96.8 million, plus adjusted EBITDA for the first nine months of 2019 of $119.5 million.
- Net debt as of September 29, 2018, which is total debt of $394.0 million less cash of $52.1 million, divided by adjusted EBITDA for the trailing twelve months, was 2.6 times. Adjusted EBITDA for the trailing twelve months ending September 29, 2018 was $130.0 million and is calculated using the full year 2017 adjusted EBITDA of $97.5 million less adjusted EBITDA for the first nine months of 2017 of $64.3 million, plus adjusted EBITDA for the first nine months of 2018 of $96.8 million.
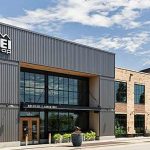
Photo courtesy Yeti


