Under Armour, Inc. recorded a 41.8% jump in first quarter net revenues to $124.3 million compared to net revenues of $87.7 million in the first quarter of 2006. First quarter net income increased 13.8% to $9.9 million compared to $8.7 million in the same period of 2006. Diluted earnings per share amounted to 20 cents, on weighted average common shares outstanding of 49.8 million compared to 18 cents per share on weighted average common shares outstanding of 49.5 million in the first quarter of the prior year.
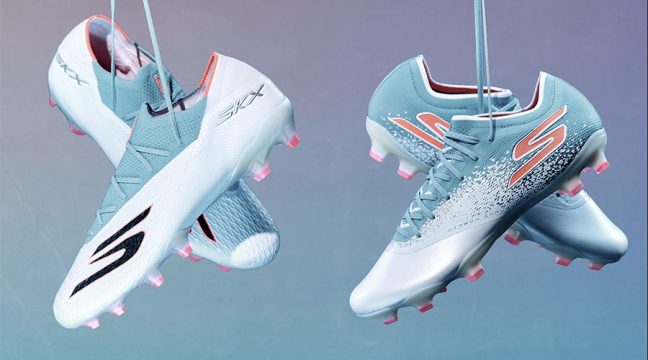
Apparel revenues grew 26.9% for the quarter and accounted for $22.0 million of the year-over-year increase in net revenues. The Compression category continued to drive revenue growth across the apparel business. The company was able to augment its apparel revenue growth with expanded assortments in key categories such as Baseball and Golf. Apparel revenues also benefited from an increase in average selling price due to the expansion of the company's product offerings. Footwear, which was not offered in the first quarter of the prior year, contributed $11.8 million in net revenues for the quarter.
“Our first quarter revenue growth of 42 percent reflects the growing strength of the Under Armour Brand,” stated Kevin A. Plank, chairman and CEO of Under Armour, Inc. “Our core apparel business remains very strong, and we saw excellent consumer demand for new products as we expanded our offerings in key apparel categories. These strong results reflect our ability to balance our growth with investments in both our Brand and the growth drivers that will fuel our long-term profitability.”
“The strengthening demand for performance fabrications continues to drive our focus as we look for opportunities to expand the reach of our Brand and bring innovation to the athlete. We believe the increase in average selling prices for our apparel products is further evidence that the consumer is demanding premium technology that can meet the specific needs of their athletic pursuits. Expansion into new categories and an unrelenting passion to innovate will provide us with the opportunity to tell the performance story to an expanding number of consumers as athletes across the globe experience the benefits of technical performance product.”
Gross margin for the quarter was 48.7% compared to 50.5% in the prior year primarily due to the impact of footwear, which was launched in the second quarter of 2006 and carries a lower gross margin than apparel. Selling, general and administrative expenses were 35.8% of net revenues in the first quarter of 2007 compared to 34.3% in the same period of the prior year primarily driven by an increase in marketing expense. Marketing expense for the first quarter was 11.1% of net revenues compared to 8.6% in the prior year due to continued investments made to support the Brand.
Balance Sheet Highlights
Inventory totaled $80.1 million at March 31, 2007, compared to $53.5 million at the end of the same period of the prior year. The increase includes inventory for the company's European operations, which did not contribute to inventory levels in the first quarter of the prior year. Cash and cash equivalents, net of debt, increased to $50.8 million at March 31, 2007 compared to $49.8 million at the end of the same period of the prior year. The company had no borrowings under its $100 million revolving credit facilities.
Outlook for 2007
The company has previously stated its long-term growth targets of 20% to 25% for the top and bottom line. For 2007, the company reiterates its expectations for annual net revenues in the range of $560 million to $580 million, an increase of 30% to 35% over 2006. The company also reiterates its expectations for 2007 income from operations to be in the range of $74.5 Million to $77.5 Million, an increase of 30% to 35% over 2006. The company expects an effective tax rate of 40.8%, an increase over the previously provided estimate of 40.5%. The company continues to anticipate fully diluted weighted average shares outstanding of approximately 50.5 million for 2007.
The company remains committed to investing in its marketing budget at the high-end of the range of 10% to 12% of net revenues for the full year. However, due to the timing of planned investment in marketing, the company plans to exceed this range for the second quarter. As a result, the company plans second quarter earnings per share in the range of 2 cents to 3 cents.
“We believe Under Armour is the athletic brand of this generation,” Mr. Plank concluded. “As our revenue base broadens, we're communicating performance benefits to new consumers while staying true to our year-round messaging to the elite athlete. Our marketing spend represents everything from this past weekend's NFL draft day media blitz, to our permanent signage inside of Wrigley Field, the first and only of its kind. Moving forward in 2007, we will execute on our Brand strategy with a major multi-platform women's campaign and the construction of Under Armour concept shops within some of our key retail partners domestically and abroad. From that standpoint, we remain dedicated to supporting our authenticity and maintaining a consistent, loyal connection to the athletes of this generation.”
Under Armour, Inc.
Quarters Ended March 31, 2007 and 2006
(Unaudited; in thousands, except per share amounts)
             CONDENSED CONSOLIDATED STATEMENTS OF INCOME

                               Quarter             Quarter
                                 Ended   % of Net   Ended   % of Net
                                3/31/07   Revenues  3/31/06  Revenues
                               --------- --------- -------- ---------

Net revenues                   $124,329     100.0% $87,696     100.0%
Cost of goods sold               63,748      51.3%  43,384      49.5%
                               --------- --------- -------- ---------
        Gross profit             60,581      48.7%  44,312      50.5%

Operating expenses
    Selling, general and
administrative expenses          44,544      35.8%  30,132      34.3%
                               --------- --------- -------- ---------

        Income from operations   16,037      12.9%  14,180      16.2%

    Other income, net               694       0.6%     498       0.5%
                               --------- --------- -------- ---------

        Income before income
         taxes                   16,731      13.5%  14,678      16.7%
Provision for income taxes        6,790       5.5%   5,944       6.7%
                               --------- --------- -------- ---------

        Net income               $9,941       8.0%  $8,734      10.0%
                               --------- --------- -------- ---------

Net income available per common share
Basic                             $0.21              $0.19
Diluted                           $0.20              $0.18

Weighted average common shares outstanding
Basic                            47,619             46,486
Diluted                          49,818             49,499


