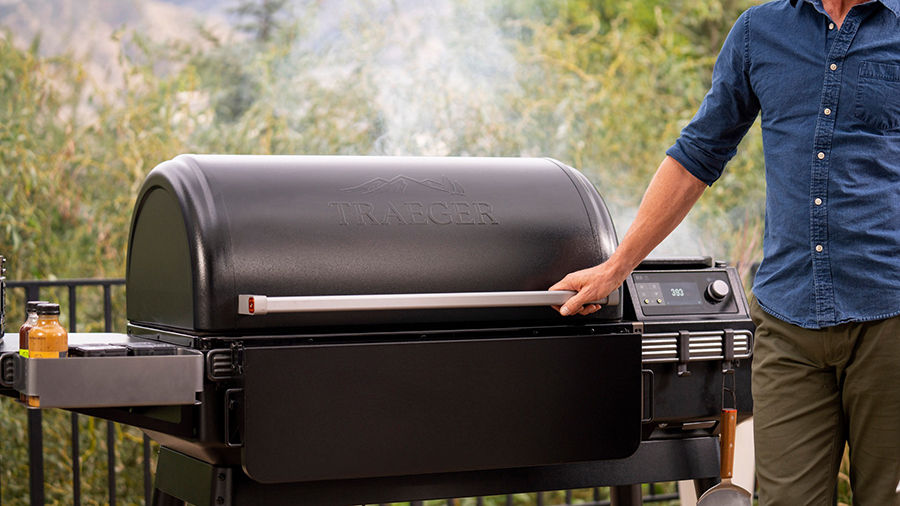
Traeger, Inc. slightly raised its guidance for 2023 as sales grew 26 percent in the third quarter ended September 30, led by a 45 percent jump in grills. The company attributed the improvement to more normalized replenishment rates following its inventory destocking efforts.
Third Quarter FY 23 Highlights
- Total revenues increased 25.5 percent to $117.7 million;
- Gross profit margin of 37.9 percent, up 1,120 basis points compared to prior year;
- Net loss of $19.3 million compared to net loss of $211.1 million compared to the prior year;
- Adjusted EBITDA of $4.7 million, up from a $13.0 million loss in the prior year; and
- Increases midpoint of FY 2023 revenue, gross margin and Adjusted EBITDA guidance.
“I am pleased with our third quarter financial results, which were ahead of our expectations,” said Jeremy Andrus, CEO of Traeger. “Third quarter’s performance is the direct result of our team’s unrelenting focus over the last year on positioning Traeger for improved financial flexibility and profitability. Our efforts to rightsize channel inventories allowed for more normalized replenishment rates at retail in the quarter which drove strong growth in grills compared to last year. Moreover, we are now seeing greater benefit from lower supply chain costs, which in combination with expense discipline, drove a meaningful improvement in adjusted EBITDA in the third quarter.”
Andrus continued, “Given the better-than-expected results in the third quarter, we are increasing the midpoint of our revenue, gross margin and adjusted EBITDA outlook for the full year. I believe we continue to be strongly positioned to execute our strategy to materially grow penetration and awareness of the Traeger brand. We recognize that the macroeconomic backdrop remains volatile and we will manage the business prudently as we look to create long-term value for our shareholders.”
Operating Results for the Third Quarter
Total revenue increased 25.5 percent to $117.7 million, compared to $93.8 million in the third quarter last year.
- Grills increased 45.1 percent to $56.6 million as compared to the third quarter last year. The increase was primarily driven by an increase in unit volumes, partially offset by a decrease in average selling price due to strategic pricing actions;
- Consumables increased 0.9 percent to $25.4 million as compared to the third quarter last year. The increase was driven by higher unit volumes of food consumables, partially offset by lower average selling prices of wood pellets and food consumables;
- Accessories increased 20.7 percent to $35.8 million as compared to the third quarter last year. This increase was driven primarily by higher sales of MEATER smart thermometers as well as the growth of Traeger branded accessories.
North America revenue increased 23.6 percent in the third quarter compared to the prior year. Rest of World revenues increased 40.0 percent in the third quarter compared to the prior year.
Gross profit increased to $44.7 million, compared to $25.1 million in the third quarter last year. Gross profit margin was 37.9 percent in the third quarter, compared to 26.7 percent in the same period last year. Excluding restructuring costs, gross profit margin was 28.5 percent in the third quarter of last year. The increase in gross margin was driven primarily by favorability from freight and logistics costs.
Sales and marketing expenses were $25.9 million, compared to $25.5 million in the third quarter last year. The increase in sales and marketing expense was driven by higher employee costs and stock-based compensation expense, largely offset by a reduction in variable costs.
General and administrative expenses were $24.8 million, compared to $70.5 million in the third quarter last year. The decrease in general and administrative expense was driven by a decrease in stock-based compensation expense of $47.8 million primarily due to the accelerated vesting in the comparable period of $40.5 million of modified awards held by the CEO and certain directors.
Net loss was $19.3 million in the third quarter, or a loss of $0.16 per diluted share, compared to net loss of $211.1 million in the third quarter of last year, or a loss of $1.76 per diluted share, which included a non-cash goodwill impairment charge of $110.8 million.1
Adjusted net loss was $14.3 million, or $0.12 per diluted share compared to $73.6 million, or $0.61 per diluted share in the third quarter last year.2
Adjusted EBITDA was $4.7 million in the third quarter compared to an Adjusted EBITDA loss of $13.0 million in the same period last year.2
Balance Sheet
Cash and cash equivalents at the end of the third quarter totaled $11.3 million, compared to $39.1 million at December 31, 2022.
Inventory at the end of the third quarter was $101.9 million, compared to $153.5 million at December 31, 2022. The decrease in inventory was driven primarily by strategic inventory management.
Guidance For Full Year Fiscal 2023
The company is updating its guidance for Fiscal 2023. The company’s updated outlook reflects better-than-expected third-quarter performance and expected growth in revenue and Adjusted EBITDA in the fourth quarter.
- Total revenue is expected to be between $590 million and $600 million. (Previous guidance: Total revenue was expected to be between $585 million and $600 million);
- Gross Margin is expected to be between 36.5 percent and 37 percent (Previous guidance: gross margin was expected to be between 36 percent and 37 percent); and
- Adjusted EBITDA is expected to be between $57 million and $59 million (Previous guidance: adjusted EBITDA was expected to be between $55 million and $59 million).
Photo courtesy Traeger


