
Oxford Industries, Inc., owner of the Tommy Bahama, Lilly Pulitzer and Johnny Was brands, reported consolidated second-quarter net sales increased 16 percent year-over-year (YoY) to $420 million in the quarter ended July 29, compared to $363 million in the second quarter of fiscal 2022.
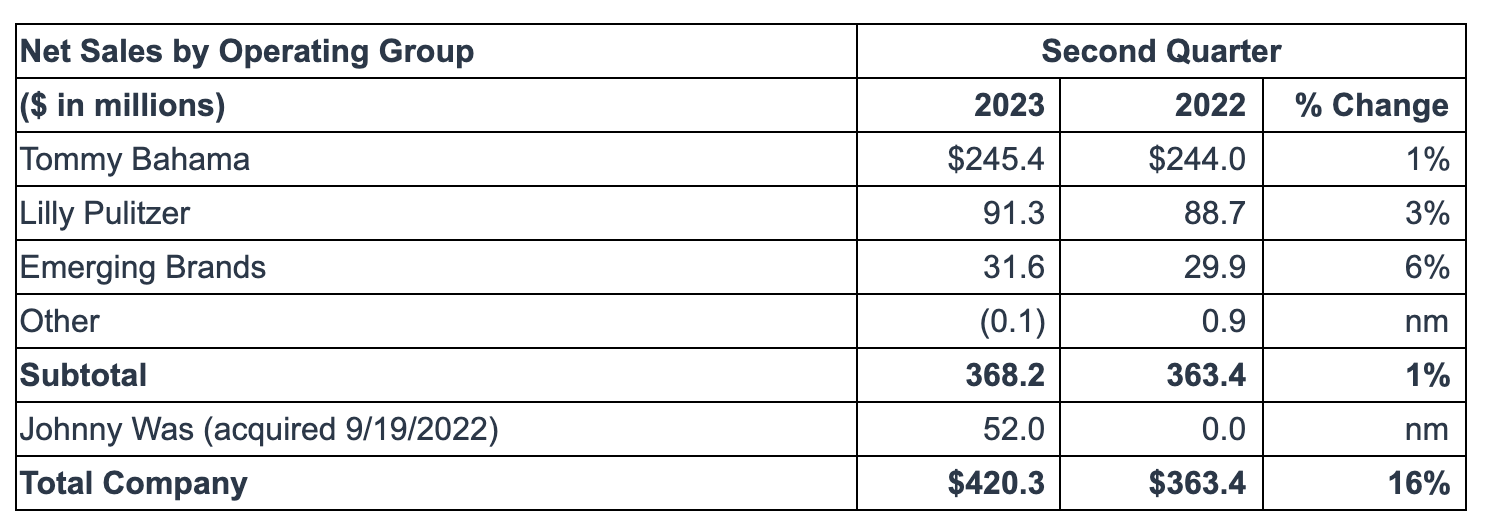
Oxford Industries, Inc., owner of the Tommy Bahama, Lilly Pulitzer and Johnny Was brands, reported consolidated second-quarter net sales increased 16 percent year-over-year (YoY) to $420 million in the quarter ended July 29, compared to $363 million in the second quarter of fiscal 2022.
Full-price DTC sales increased 13 percent YoY to $286 million versus the second quarter of fiscal 2022, including $41 million of DTC sales in Johnny Was and a 3 percent aggregate decrease in full-price DTC sales in the company’s other businesses.
- Full-price retail sales of $150 million were 11 percent higher than the prior-year period; this includes full-price retail sales in Johnny Was of $18 million for the second quarter of fiscal 2023. Full-price retail sales in the company’s other businesses decreased by 3 percent.
- Full-price e-commerce sales grew 15 percent YoY to $136 million in the second quarter; this includes full-price e-commerce sales in Johnny Was of $22 million. Full-price e-commerce sales in the company’s other businesses decreased by 4 percent.
Outlet sales were $21 million, a 9 percent increase versus prior-year Q2 results, primarily due to the addition of Johnny Was.
There were $16 million of Lilly Pulitzer e-commerce flash sales in the second quarter of fiscal 2023 compared to no Lilly Pulitzer flash sales in the second quarter of fiscal 2022.
Food and beverage sales grew 8 percent to $30 million versus last year.
Wholesale sales of $68 million were 9 percent higher than the second quarter of fiscal 2022. Johnny Was contributed wholesale sales of $10 million for the second quarter of fiscal 2023, with the other businesses in the aggregate decreasing by 7 percent.
Gross margin was 63.9 percent of sales on a GAAP basis, which were comparable to prior-year results. Adjusted gross margin was 64.3 percent of sales compared to 64.6 percent of sales on an adjusted basis in the second quarter of fiscal 2022. Second quarter gross margin reportedly reflects increased e-commerce flash sales at Lilly Pulitzer and a larger proportion of sales during loyalty award cards, flipside, and end-of-season clearance events at Tommy Bahama, partially offset by the higher gross margin of Johnny Was and reduced freight expense.
SG&A was reported at $205 million in Q2, compared to $163 million in Q2 last year, increasing primarily due to $32 million of Johnny Was SG&A in the second quarter of 2023, which includes $3 million of amortization of intangible assets. Across all operating groups, SG&A increased due to increases in employment costs, advertising costs, variable expenses, occupancy costs, and other expenses to support sales growth. On an adjusted basis, SG&A was $202 million compared to $163 million in the prior-year period.
Royalties and other operating income decreased by $2 million to $4 million versus last year, primarily driven by lower sales of Tommy Bahama’s licensing partners.
Operating income was $68 million, or 16.1 percent of net sales, in Q2, compared to $75 million in the second quarter of fiscal 2022. On an adjusted basis, operating income was $73 million, or 17.3 percent of net sales, compared to $78 million in last year’s second quarter. Year-over-year operating income results reflect higher SG&A as the company invests in the business, partially offset by sales growth.
Interest expense increased by $1 million compared to the prior-year period. The increased interest expense was due to the debt incurred in acquiring Johnny Was in fiscal 2022.
The effective tax rate was 22.5 percent compared to 24.6 percent for the prior-year period. The second quarter of fiscal 2023 benefitted from vesting restricted share awards at a value greater than the grant date stock price.
EPS on a GAAP basis was reported at $3.22 a share for Q2, compared to $3.49 a share in Q2 last year. On an adjusted basis, EPS was $3.45 a share compared to $3.61 a share in the year-ago quarter.
In the first half of fiscal 2023, net sales grew 17 percent year-over-year to $840 million. EPS was $6.86 a share on a GAAP basis compared to $6.94 a share in H1 last year and $7.23 a share on an adjusted basis compared to $7.11 last year.
Balance Sheet and Liquidity
Inventory increased $26 million on a LIFO basis and $28 million, or 14 percent, on a FIFO basis at quarter-end, compared to the end of the second quarter of fiscal 2022. The inventory increase reflects the following:
- $18 million of Johnny Was inventory;
- anticipated sales increases in fiscal 2023; and
- higher levels of core product and higher product costs.
During the first half of fiscal 2023, cash flow from operations was $153 million compared to $91 million in the first half of fiscal 2022. The cash flow from operations in the first half of fiscal 2023 provided sufficient cash to fund $31 million of capital expenditures, $21 million of dividends, $19 million of share repurchases and $71 million to repay outstanding debt.
As of July 29, 2023, the company had $48 million of borrowings outstanding under its revolving credit agreement, compared to no borrowings at the end of the second quarter of last year. Also, the company had $8 million of cash and cash equivalents versus $186 million of cash, cash equivalents and short-term investments at the end of the second quarter of fiscal 2022. Both changes were due to the acquisition of Johnny Was.
Outlook
The company moderated its sales and EPS guidance for fiscal 2023, ending February 3, 2024. The company now expects net sales in a range of $1.57 billion to $1.60 billion in fiscal 20203 compared to net sales of $1.41 billion in fiscal 2022. In fiscal 2023, GAAP EPS is expected to be between $9.61 and $9.91 compared to fiscal 2022 GAAP EPS of $10.19. Adjusted EPS is expected to be between $10.30 and $10.60, compared to fiscal 2022 adjusted EPS of $10.88.
For the third quarter of fiscal 2023, the company expects net sales to be between $320 million and $335 million compared to net sales of $313 million in the third quarter of fiscal 2022. GAAP EPS is expected to be in a range of 74 cents to 94 cents in the third quarter compared to GAAP EPS of $1.22 in the third quarter of fiscal 2022. Adjusted EPS is expected to be between 90 cents and $1.10 compared to adjusted EPS of $1.46 in the third quarter of fiscal 2022.
In addition to a more cautious macroeconomic environment, updated guidance reflects a negative impact from the wildfires in Maui, where Oxford has six brick-and-mortar locations, two of which are food and beverage locations. Updated sales guidance is impacted by approximately $7 million for the second half of fiscal 2023, while EPS is impacted by roughly $0.20. These changes are expected to be split evenly between the third and fourth quarters.
The company anticipates interest expense of $5 million in fiscal 2023, including the $4 million in the first half of fiscal 2023, as strong cash flows allow for continued debt reduction during fiscal 2023. The company’s effective tax rate is expected to be approximately 24 percent for the full year of fiscal 2023.
Capital expenditures in fiscal 2023, including the $31 million in the first half of fiscal 2023, are expected to be approximately $90 million compared to $47 million in fiscal 2022. The planned increase is primarily due to increased investment in new brick-and-mortar retail stores and food and beverage locations, including certain relocations and remodels of existing sites, various technology systems initiatives, and the anticipated initial spend associated with a multi-year southeastern U.S. fulfillment center enhancement project to ensure DTC through out capabilities for the company’s brands.
Chart courtesy Oxford Industries/Photo courtesy Tommy Bahama