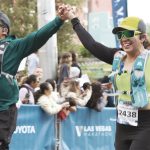
With the lifting of pandemic restrictions, runners are eager to participate in live running events, according to Running USA’s 2022 Global Runner Survey.
The survey found that the most popular running shoe is manufactured by Brooks, followed by Nike, Asics, New Balance, and Hoka.
In the survey of more than 5,000 runners conducted from April to May 2022, 66 percent of respondents said they plan to increase their participation in running events over the next 12 months. Twenty-nine percent will participate in the same number of events as the prior twelve months, with only 5 percent of respondents running fewer events.
For the survey, a runner is a self-selected who participates in movement —running, jogging, or walking—at any point during the calendar year and may or may not participate in organized running events.
The survey found that 49 percent of runners had participated in virtual events over the last 12 months. On average, those who participated in virtual events participated in 18. A total of 18 percent chose to participate in virtual events rather than in-person events.
In the future, however, only 11 percent of respondents said they plan to finish more virtual events over the next 12 months; 43 percent, about the same; 22 percent, fewer virtual races; and 24 percent were not sure.
Exploring event attitudes and perceptions, 75 percent agreed that virtual races did not match up to a real-life experience, with 10 percent disagreeing.
The study found that virtual races appealed slightly more to younger runners; among runners under 25 years old, 21 percent plan to run more virtual events in 2023 versus 11 percent for other age groups.
The half marathon continues to be the favorite race event by survey participants, cited by 59 percent; followed by 5K, 17 percent; 10K, 14 percent; marathon, 12 percent; 4 mile/8K/5 mile, 10 percent; 2K/15K/10 mile, 9 percent; 1 mile/2 mile, 6 percent; ultra-marathon, 2 percent; and 20K/25K/30K, 1 percent.
Asked about their favorite event type, the number one response was the traditional road race, cited by 59 percent; followed by trail, 17 percent; triathlon/duathlon, 10 percent; mud/obstacle, 7 percent; and relay, also 7 percent.
Asked which events they participated in the last twelve months, the most common response was the 1 mile/2 mile/5K category, cited by 73 percent; followed by 4 mile/8K/5 mile, 64 percent; half marathon, 60 percent; 12K/15K/10 mile, 44 percent; marathon, 43 percent; 20K/25K/30K, 26 percent; and ultra-marathon, 20 percent.
Among the more-popular longer races, 42 percent ran a half marathon virtually over the last 12 months, and 35 percent participated virtually in a marathon.
Asked about reasons for running, the top response was to stay in shape/stay healthy, cited by 72 percent; relieve stress, 38 percent; enjoyment, 33 percent; meet a personal challenge, 31 percent; train for a specific race, 26 percent; improve speed/endurance, 23 percent; appreciate nature, 21 percent; achieve goals/personal record, 20 percent; solitude, 19 percent; socialize, 18 percent; overcome a health obstacle, 5 percent; and raise money for a cause/charity, 3 percent.
Asked about the reasons they chose to run a certain event, the top five answers were the distance they prefer, 66 percent; event date, 54 percent; convenient location, 53 percent; place they want to visit, 31 percent; and desirable course, 28 percent.
Probing event attitudes and perceptions, 68 percent agreed it’s easy to find an event to participate in, 66 percent look for new event experiences, and 40 percent agreed running events are better today than five years ago.
Cost continues to be a barrier to participation.
Among the survey respondents, 66 percent said they would participate in more events if entry fees were lower, although 58 percent agreed they receive good value for their race entry fees. Fifty-seven wished races offered something other than a finisher t-shirt.
On average, respondents spent $1,748 on their running hobby over the past twelve months, with the most spending on running shoes, followed by running apparel, nutrition, and hydration.
Asked to cite their favorite running brands (more than one answer could be given), the top was Brooks, cited by 39 percent; fNike, 24 percent; Asics, 23 percent; New Balance, 21 percent; Hoka, 19 percent; Saucony, also 19 percent; Adidas, 17 percent; Altra, 9 percent; Mizuno, 9 percent; Salomon, 4 percent; and On, 2 percent.
Asked about favorites in running apparel, Nike was the number one brand cited by 37 percent;Brooks, 28 percent; Under Armour, 25 percent; New Balance, 19 percent; Lululemon, 15 percent; Asics, 14 percent; Champion, also 14 percent; Athleta, 11 percent; Target, 8 percent; Oiselle, 8 percent; Reebok, 8 percent; Craft, 6 percent; and Tracksmith, 3 percent.
Asked about their favorite sports hydration brand, Nuun took the top spot, cited by 36 percent; Gatorade, 35 percent; Powerade, 17 percent; Bodyarmor, 10 percent; Skratch Lab, 10 percent; and Tailwind Nutrition, 9 percent.
The top sports fuel was Gu, cited by 29 percent of respondents, followed by Honey Stinger, 28 parent; Kind, 25 percent; Clif Bar, 20 percent; Larabar, 13 percent, Pickey Bars, 8 percent; RX Bar, 7 percent; and Tailwind Nutrition, 7 percent.
The top running app was Garmin, cited by 49 percent; followed by Strava, 31 percent; Apple Fitness Plus, 19 percent; Nike Run Club, also 19 percent; Under Armour, 16 percent; Fitbit, 11 percent, Adidas Running, 10 percent; Asics Runkeeper, also 10 percent; Peloton, 7 percent, and Charge Running and Jogga, tied at 6 percent.
Photo courtesy Brooks