According to the NSGA, retail sales of sporting goods, which reached a record $51.3 billion in 2005, are expected to grow 3% in 2006. For 2006, sales of athletic and sports equipment, shoes and clothing are forecast to reach $53.0 billion.
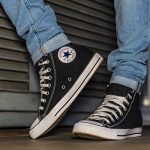
In 2005, athletic and sport footwear grew 7%, reaching $15.7 billion. Clothing showed a 4% gain, reaching $11.7 billion. Equipment, which accounted for $24.0 billion in sales, showed a 3% gain.
“Among equipment categories with sales of more than $1 billion in 2005, golf showed the greatest increase,” said NSGA Vice President of Information & Research Thomas B. Doyle. “Golf equipment sales rose 9% to $3.5 billion in 2005, despite participation that grew less than 1% last year.”
Hunting, fishing and fitness also showed increases among equipment categories with more than $1 billion in sales, while camping sales declined in 2005. Hunting & firearms equipment sales rose to $3.4 billion in 2005 from $3.2 billion the previous year (+6%). Fishing tackle increased 6% to $2.1 billion. Exercise equipment sales (the largest equipment category at $5.2 billion) rose 3%.
Camping equipment sales experienced a 6% decline with $1.4 billion in sales in 2005, versus $1.5 billion the previous year. In addition to camping, six of the 25 equipment categories surveyed by the Association last year also slipped. Billiards & indoor games (-8%), hockey & ice skates (-4%), downhill skis (-2%), cross country skis (-21%), water skis (-9%) and wheeled sports (-25%) showed sales declines in 2005.
Sales of recreational transport equipment (bicycles, pleasure boats and motors, recreational vehicles and snowmobiles) reached $38.5 billion in 2005, an increase of 5%. Sales for 2006 are forecast to decline by 4%. The recreational transport category has risen dramatically in recent years. High gasoline prices are expected to have a dampening effect on RV travel and boating this year.
“The Sporting Goods Market in 2006” is a copyrighted NSGA consumer study that projects 2005 purchases of sporting goods products based on a survey of 100,000 U.S. households. National Family Opinion, Inc., maintains the consumer panel used in the survey, which is balanced to parallel actual American household distribution as reported by the U.S. Bureau of Census, so that the data can be projected nationally.


