Newell Brands reported a sharp decline in operating earnings in the fourth quarter as it absorbed a $157 million impairment charge. Revenues declined 6 percent.
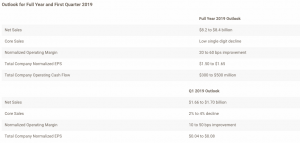
“Newell Brands’ fourth quarter results reflect solid progress as we continue to execute the Accelerated Transformation Plan (ATP) announced one year ago,” said Michael Polk, president and chief executive officer of Newell Brands. “We were encouraged by the sequential improvement in core sales growth across all segments, the return to growth of our Learning & Development segment driven by building momentum on Writing, and solid margin expansion as a result of continued diligent cost management and pricing. We returned $1.1 billion to our shareholders through dividends and share repurchases and paid down $2.6 billion in debt during the quarter, exiting the year at our targeted leverage ratio. We’ve planned 2019 to be another year of significant portfolio and organization transformation. We intend to drive the ATP to completion in 2019, and despite the ongoing negative impact of retailer bankruptcies, foreign exchange, inflation and tariffs, we expect to stabilize and then reignite core sales growth, increase margins, and strengthen the operational and financial performance of the company.”
Fourth Quarter 2018 Operating Results
Net sales were $2.3 billion, compared to $2.5 billion in the prior year period, a 6.0 percent decline attributable to headwinds from the adoption of the new 2018 revenue recognition standard, unfavorable foreign exchange and a decline in core sales.
Reported gross margin was 34.7 percent compared with 32.7 percent in the prior year period, resulting from pricing, productivity, lower integration and restructuring costs and the impact of the new revenue recognition standard, which more than offset the headwinds from foreign exchange and inflation related to higher input costs, tariffs and transport costs. Normalized gross margin was 34.7 percent compared with 33.0 percent in the prior year period.
The company recorded a $157 million non-cash impairment charge from continuing operations primarily associated with intangible assets in certain acquired businesses. The impairment charge is attributable to the latest cash flow projections associated with these businesses.
Reported operating income was $17.8 million, or 0.8 percent of sales, compared with $142 million, or 5.7 percent of sales, in the prior year period, as improved gross margin and a reduction in overhead, integration and restructuring costs, were more than offset by the impact of the non-cash impairment charge and an increase in accrued incentive compensation. Normalized operating income was $268 million compared with $267 million in the prior year period. Normalized operating margin was 11.4 percent compared to 10.7 percent in the prior year period.
The company reported a tax benefit of $254 million compared with a benefit of $1.5 billion in the prior year period, with the difference primarily attributable to the absence of the $1.4 billion benefit from tax reform in 2017. The normalized tax rate was negative 30.0 percent, for a benefit of $49.5 million, compared with 3.7 percent, or a provision of $5.4 million, in the prior year period.
The company reported net income of $208 million compared with $1.7 billion in the prior year period, with the decline primarily attributable to the absence of the tax benefit recorded in 2017. Continuing operations posted net income of $164 million compared with $1.5 billion in the fourth quarter of last year. Discontinued operations generated net income of $44.3 million versus $154 million in the year-ago period. Reported diluted earnings per share for the total company were $0.46 compared with $3.38 in the prior year period. Reported diluted earnings per share from continuing operations were $0.36 versus $3.07 in the prior year period. Reported diluted earnings per share from discontinued operations were $0.10 compared with $0.31 in the prior year period.
Normalized net income for the total company was $321 million, or $0.71 per share, compared with $335 million, or $0.68 per share, in the prior year period. Normalized diluted earnings per share from continuing operations were $0.47, compared with $0.28 in the prior year period. Normalized diluted earnings per share from discontinued operations were $0.24 compared with $0.40 in the prior year period.
Operating cash flow was $498 million compared with $990 million in the prior year period, with the difference attributable to the absence of the operating cash flow contribution from divested businesses, increased cash taxes and transaction-related costs, and a change in the timing of vendor payments relative to the prior year.
Fourth Quarter 2018 Operating Segment Results
The Learning & Development segment generated net sales of $707 million compared with $730 million in the prior year period, as strong core sales growth in Writing was more than offset by the negative impacts of unfavorable foreign exchange, the adoption of the new 2018 revenue recognition standard and a core sales decline for Baby related to the continued negative impact of the Toys ‘R’ Us bankruptcy. Core sales grew 1.7 percent as compared with the prior year period, a sequential improvement versus third quarter results. Reported operating income was $135 million compared with $97.8 million in the prior year period. Reported operating margin was 19.2 percent as compared with 13.4 percent in the prior year period. Normalized operating income was $139 million versus $103 million in the fourth quarter of last year. Normalized operating margin was 19.7 percent of sales compared with 14.0 percent in the prior year period.
The Food & Appliances segment generated net sales of $824 million compared with $888 million in the prior year period, primarily due to the adoption of the new 2018 revenue recognition standard, unfavorable foreign exchange, and a core sales decline of 1.7 percent as compared with the prior year period, largely attributable to reduced promotional activity in Food. The core sales trend represents a sequential improvement versus third quarter results. Reported operating loss was $19.3 million compared with operating income of $105 million in the prior year period, largely due to the negative impact of the non-cash impairment charge. Reported operating margin was negative 2.3 percent as compared with 11.8 percent in the prior year period. Normalized operating income was $96.5 million versus $116 million in the fourth quarter of last year. Normalized operating margin was 11.7 percent of sales compared with 13.0 percent in the prior year period.
The Home & Outdoor Living segment generated net sales of $809 million compared with $872 million in the prior year period, with the change primarily attributable to the adoption of the new 2018 revenue recognition standard, unfavorable foreign exchange and a core sales decline of 3.0 percent, largely driven by lost distribution for Coleman at a key U.S. retailer. These negative impacts were partially offset by strong growth from Connected Home & Security and a return to growth of Home Fragrance in Europe. The core sales trend represented a sequential improvement compared with third quarter results. Reported operating income was $45.5 million compared with $108 million in the prior year period, largely due to the negative impact of the non-cash impairment charge. Reported operating margin was 5.6 percent as compared with 12.4 percent in the prior year period. Normalized operating income was $110 million compared with $131 million in the prior year period. Normalized operating margin was 13.5 percent of sales compared with 15.0 percent in the fourth quarter of last year.
Full Year 2018 Results
Net sales for the full year ended December 31, 2018 were $8.6 billion, a decline of 9.6 percent compared with $9.6 billion in the prior year. Core sales declined 5.2 percent.
Reported gross margin was 34.9 percent, compared with 34.2 percent in the prior year. Normalized gross margin was 34.8 percent, in line with the prior year.
The company reported a full year 2018 operating loss of $7.8 billion compared with operating income of $386 million in the prior year. Reported operating margin was negative 90.7 percent compared with 4.0 percent in the prior year. Normalized operating income was $878 million compared with $1.1 billion in the prior year. Normalized operating margin was 10.2 percent compared with 11.1 percent in the prior year.
Reported net loss was $6.9 billion compared with net income of $2.7 billion in the prior year. Reported diluted loss per share was $14.60 compared with reported diluted earnings per share of $5.63 in the prior year. Normalized net income was $1.3 billion, approximately in line with the prior year. Normalized diluted earnings per share were $2.68 compared with $2.75 in the prior year.
Operating cash flow was $680 million compared to $966 million in the prior year, reflecting taxes paid in 2018 related to gains from divested businesses, the absence of cash flow contributions from divested businesses and unfavorable working capital movements.
The company exited the year with a gross debt leverage ratio of 3.5x.]
 Newell Brands (NASDAQ: NWL) is a leading global consumer goods company with a strong portfolio of well-known brands, including Paper Mate, Sharpie, Dymo, EXPO, Parker, Elmer’s, Coleman, Marmot, Oster, Sunbeam, FoodSaver, Mr. Coffee, Graco, Baby Jogger, NUK, Calphalon, Rubbermaid, Contigo, First Alert, and Yankee Candle.


