Newell Brands raised its full-year earnings guidance after reporting third-quarter earnings that exceeded Wall Street’s targets excluding a goodwill impairment charge. Sales in the Home & Outdoor Living segment slid in part due to lost distribution for Coleman at a key U.S. retailer.
“Our third quarter results reflect solid progress in a number of areas as we continue to execute the Accelerated Transformation Plan announced in January of this year,” said Michael Polk, president and chief executive officer of Newell Brands. “Our focus on margins and operating cash flow has begun to pay off as we generated strong sequential improvement on both metrics resulting from organization restructuring and diligent cost and working capital management. Core sales results in our continuing business improved sequentially in all segments and regions and we expect that trend to continue into the fourth quarter. We were particularly pleased with the improved trajectory in our Learning & Development segment. Writing core sales returned to growth and we made good financial progress despite the continued impact of the Toys “R” Us bankruptcy on Baby. We passed more than $600 million back to investors in share repurchase and dividends, deployed about $900 million against debt repayment during the quarter and completed a tender offer for another $1 billion in debt reduction in October. We are laser focused on strengthening the operating performance and financial flexibility of the company and are confident that the Accelerated Transformation Plan will create significant value and a return of capital for shareholders.”
Third Quarter 2018 Executive Summary
- Net sales from continuing operations were $2.28 billion, compared with $2.5 billion in the prior year, reflecting a $61 million headwind from the adoption of the new 2018 revenue recognition standard, unfavorable foreign exchange and a decline in core sales. Sales were short of Wall Street’s target of $2.35 billion.
- Core sales from continuing operations declined 4.0 percent. All segments and regions posted better core sales trends on a sequential basis, with the Writing business returning to growth. In the third quarter of 2017, the company recorded approximately $55 million of core sales at Toys “R” Us (TRU) which did not repeat at this customer.
- The company recorded an $8.1 billion non-cash impairment charge from continuing operations primarily related to impairment of goodwill and trade names, the majority of which is attributable to the impact of the decline in the company’s market capitalization during the third quarter. The intangible asset valuation is capped at the fair value of the company, defined as the enterprise value at a reasonable premium.
- Reported operating margin was a negative 347 percent; reported diluted loss per share for the total company was $15.10 compared with earnings of $0.48 in the prior year; and reported diluted loss per share from continuing operations was $14.43 versus earnings of $0.23 in the previous year. The declines were primarily attributable to the impairment charge, which more than offset significantly reduced restructuring and integration costs.
- Normalized operating margin was 13.0 percent compared to 12.9 percent in the prior year.
- Normalized diluted earnings per share from continuing operations were $0.54, in line with the prior year. Normalized diluted earnings per share for the total company were $0.81, compared with $0.86 in the prior year.
- Operating cash flow was $572 million compared with $183 million in the prior year, driven primarily by progress on the company’s working capital initiatives.
- The company reduced debt by $890 million to $9.6 billion and deployed $107 million to payment of dividends and $511 million to share repurchase.
- The company reaffirmed its 2018 full year outlook for net sales of $8.7 billion to $9.0 billion and operating cash flow of $900 million to $1.2 billion.
- The company increased 2018 full year outlook for normalized earnings per share by 10 cents to $2.55 to $2.75 per share, driven by discrete tax benefits.
Third Quarter 2018 Operating Results
Net sales were $2.3 billion, compared to $2.5 billion in the prior year, with the 7.7 percent decline attributable to the impact of the adoption of the new 2018 revenue recognition standard, unfavorable foreign exchange and a 4.0 percent decline in core sales from continuing operations.
Reported gross margin was 35.9 percent compared with 35.1 percent in the prior year, resulting from better pricing, productivity, lower integration and restructuring costs and the impact of the new revenue recognition standard, which more than offset the impact of foreign exchange, inflation related to tariffs and higher input costs and other manufacturing costs associated with inventory reduction. Normalized gross margin was 35.7 percent compared with 35.8 percent in the prior year.
The company recorded an $8.1 billion non-cash impairment charge from continuing operations primarily associated with intangible assets in certain acquired businesses in each of its reporting segments. The impairment charge is attributable to (a) the impact of the company’s enterprise value pullback experienced in the third quarter, and (b) the latest cash flow projections associated with these businesses. The intangible asset valuation is capped at the fair value of the company defined as the enterprise value at a reasonable premium.
Reported operating loss was $7.9 billion compared with operating income of $141 million in the prior year, reflecting the impact of the impairment charge. Normalized operating income was $296 million compared with $319 million in the prior year. Normalized operating margin was 13.0 percent compared to 12.9 percent in the prior year.
The reported tax benefit for the quarter of $1.2 billion compared with a benefit of $131 million in the prior year, primarily driven by tax effects associated with the company’s impairment charge and integration of certain legal entities. The normalized tax rate was a negative 37.2 percent, for a benefit of $69.3 million, compared with a negative 30.0 percent, or benefit of $61.1 million, in the prior year.
The company reported a net loss of $7.1 billion compared with net income of $234 million in the prior year, with the decline primarily attributable to the total company impairment charge of $8.7 billion. Continuing operations posted a net loss of $6.8 billion compared with net income of $111 million last year. Discontinued operations reported a $317 million net loss, including a $517 million impairment charge, versus net income of $123 million in the year-ago period. Reported diluted loss per share for the total company was $15.10 compared with earnings of $0.48 in the prior year. Reported diluted loss per share from continuing operations was $14.43 versus earnings of $0.23 in the previous year. Reported diluted loss per share from discontinued operations was $0.67 compared with earnings of $0.25 in the prior year.
Normalized net income for the total company was $384 million, or $0.81 per share, compared with $421 million, or $0.86 per share, in the prior year. Normalized diluted earnings per share from continuing operations were $0.54, in line with the prior year. Normalized diluted earnings per share from discontinued operations were $0.27 compared with $0.32 in the prior year.
Operating cash flow was $572 million compared with $183 million in the prior year, driven by strong execution of inventory management and other working capital improvements, as well as lower tax payments.
Third Quarter 2018 Operating Segment Results
The Food & Appliances segment generated net sales of $722 million compared with $815 million in the prior year, reflecting the negative impacts of the new 2018 revenue recognition standard, foreign exchange and continuing challenges on Appliances related to lost distribution at a key U.S. retailer, which more than offset improved results from Food. The company expects core sales trends to improve sequentially in the fourth quarter related to new product launches on Appliances and Cookware. Reported operating loss was $3.3 billion compared with operating income of $105 million in the prior year, largely due to the impairment charge on intangible assets. Normalized operating income was $96.9 million versus $122 million last year. Normalized operating margin was 13.4 percent of sales compared with 15.0 percent in the prior year.
Major brands in the segment include Ball, Calphalon, Crock-Pot, FoodSaver, Mr. Coffee, Oster, Rubbermaid, Sistema and Sunbeam.
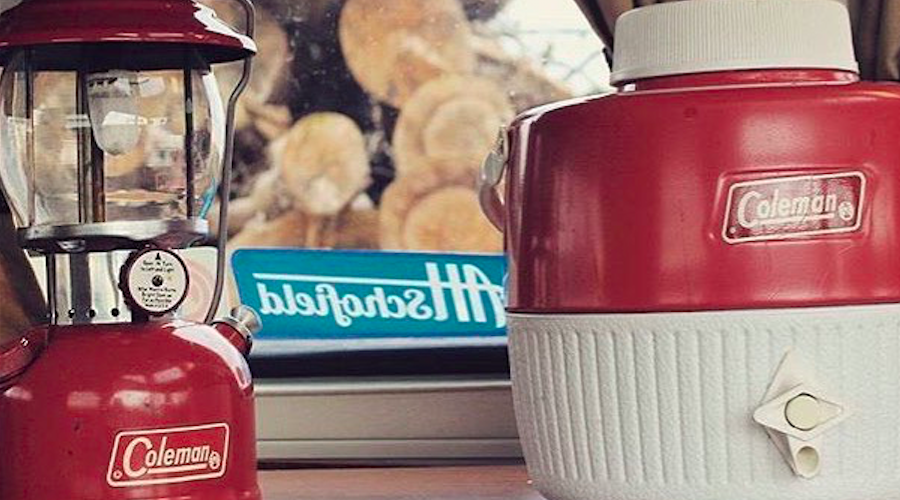
The Home & Outdoor Living segment generated net sales of $727 million compared with $780 million in the prior year, reflecting the negative impacts of the new 2018 revenue recognition standard, unfavorable foreign exchange, continuing challenges for Yankee Candle in Europe and lost distribution for Coleman at a key U.S. retailer. These outcomes were partially offset by growth from Connected Home & Security and the Home Fragrance U.S. wholesale business. The company expects core sales trends to improve sequentially in the fourth quarter related to continued strong growth on Connected Home & Security and improved performance on Home Fragrance driven by growth in the U.S. wholesale channel and stabilization in Europe. Reported operating loss was $4.3 billion compared with operating income of $95.5 million in the prior year, reflecting the impairment charge on intangible assets. Normalized operating income was $83.0 million compared with $111 million in the prior year. Normalized operating margin was 11.4 percent of sales compared with 14.2 percent last year.
The Home & Outdoor Living segment’s major brands includes Chesapeake Bay Candle, Coleman, Contigo, Ex Officio, First Alert, Marmot, WoodWick and Yankee Candle.
The Learning & Development segment generated net sales of $829 million compared with $863 million in the prior year, as a return to core sales growth in the Writing business was more than offset by the impact of the new 2018 revenue recognition standard, unfavorable currency and a decline in core sales for Baby. While down in the quarter, due largely to the disruption created by TRU’s liquidation of its U.S. stores, core sales results for the Baby division improved significantly on a sequential basis. The company expects the Learning & Development segment to return to growth in the fourth quarter related to further strengthening in Writing and continued progress on Baby, despite the continued negative impact from the TRU bankruptcy. Reported operating loss was $159 million compared with operating income of $109 million in the prior year, primarily attributable to the impairment charge on intangible assets. Normalized operating income was $195 million versus $142 million last year. Normalized operating margin was 23.5 percent of sales compared with 16.5 percent last year.
The Learning & Development segment’s major brands include Aprica, Baby Jogger, Dymo, Elmer’s, Expo, Graco, Mr. Sketch, NUK, Paper Mate, Parker, Prismacolor, Sharpie, Tigex, Waterman and X-Acto.
Accelerated Transformation Plan Update
Since announcing the Accelerated Transformation Plan on January 25th, Newell Brands has made substantial progress in achieving improved operational performance, divesting non-core businesses, deleveraging the balance sheet and returning cash to shareholders, while simultaneously moving toward a simpler, stronger and faster company.
Key achievements of the Accelerated Transformation Plan year-to-date include:
- Closing three transactions (The Waddington Group, Rawlings Sporting Goods Company and Goody Products), which account for $2.6 billion of after-tax proceeds;
- Right-sizing the cost structure and adapting organizational design to a smaller company footprint, with actions taken in the second and third quarters yielding an approximately 10 percent reduction in professional headcount on the continuing businesses;
- Allocating divestiture proceeds toward debt paydown and share repurchase:
- Debt paydown – net debt exiting the third quarter $2.5 billion lower than prior year,
- Share repurchases of $511 million in the third quarter.
As part of the company’s Accelerated Transformation Plan, during 2018, the company announced it is exploring strategic options for its industrial and commercial product assets, including Process Solutions, Rubbermaid Commercial Products and Mapa businesses, as well as non-core consumer businesses, including Goody, Jostens, Pure Fishing, Rubbermaid Outdoor, Closet, Refuse and Garage, and U.S. Playing Cards businesses. During the second quarter of 2018, the company sold the Rawlings Sporting Goods Company and Waddington Group as part of the program. These businesses are classified as discontinued operations. The company expects to complete the remaining divestitures by the end of the second quarter of 2019.
Outlook for the Twelve Months Ending December 31, 2018
Newell Brands 2018 full year guidance assumes full year ownership of all businesses held for sale, with the exception of the Waddington and Rawlings businesses which were divested as of June 29, 2018, and the Goody business, which was divested as of August 31, 2018.
The 2018 fuTThe company’s net sales outlook reflects sales from continuing operations only. Normalized earnings per share and operating cash flow guidance reflects the total company outlook. Full year 2018 weighted average share count projection is unchanged at approximately 480 million shares with weighted average share count estimated at approximately 470 million in the fourth quarter.
The company continues to expect second half normalized operating margins of 12.0 percent to 12.4 percent and now expects fourth quarter core sales growth trends to continue to improve on a sequential basis. Core sales in 2018 are calculated on a constant currency basis in line with industry practice and exclude the impact of foreign currency, acquisitions until their first anniversary and planned and completed divestitures.
Image courtesy Coleman


