Newell Brands reported a third-quarter profit. excluding charges, and sales that beat expectations while raising its full-year outlook.
“We are pleased with the progress the company is making on its turnaround journey, with third quarter operating margin, earnings per share and operating cash flow ahead of plan, fueled by a disciplined focus on productivity, overhead cost savings and working capital initiatives,” said Chris Peterson, Newell Brands Chief Financial Officer. “Stronger than anticipated performance thus far in the year gives us the confidence to raise full year guidance for normalized earnings per share to $1.63 to $1.68 and full year operating cash flow to $700 to $850 million. We are taking decisive and strategic actions to stabilize the company’s performance in the near term and return to sustainable profitable growth over time.”
Recently appointed President and Chief Executive Officer Ravi Saligram commented, “In my first 30 days, I have completed visits to all seven of our businesses, the eCommerce Group and the Design Center. It is encouraging that four of the businesses are experiencing core sales growth, online sales continue to build momentum and cash flow is increasing. I am energized by the resilience and passion of our employees and have appointed a new Chief Human Resources Officer to help maximize their potential. We will create a laser focus on driving sustainable, profitable organic growth through clarity and stability of direction, developing actionable insights that pave the way for meaningful innovation, enhancing the digital IQ of our businesses, reducing complexity and focusing the organization externally on delighting the consumer and customer.”
Third Quarter 2019 Executive Summary
- Net sales were $2.5 billion, a decline of 3.8 percent compared with the prior year period.
- Core sales declined 2.5 percent from the prior year period. Core sales increased at four of seven operating divisions.
- Reported operating margin was negative 25.9 percent compared with negative 307.4 percent in the prior year period, reflecting the impact of impairment charges recorded in both years. Normalized operating margin was 12.7 percent compared to 13.2 percent in the prior year period reflecting higher advertising spend in the current year period.
- Reported diluted loss per share for the total company was $1.48 compared with a diluted loss of $15.52 in the prior year period.
- Normalized diluted earnings per share for the total company were $0.73 compared with $0.77 in the prior year period, with the year over year change largely reflecting foregone contribution from divested businesses.
- Year-to-date operating cash flow was $424 million, compared with $182 million in the prior year, reflecting strong working capital progress partially offset by the foregone contribution from divested businesses.
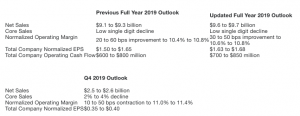
- The company increased its 2019 full year outlook for normalized earnings per share to $1.63 to $1.68 per share from $1.50 to $1.65, previously, and its full year outlook for operating cash flow to $700 million to $850 million from $600 million to $800 million, previously.
- The company successfully completed a $700 million debt tender offer, strengthening the balance sheet.
- The company announced today its decision to end its divestiture program and retain the Mapa/Spontex and Quickie businesses, which were included in discontinued operations through the third quarter of 2019. The addition of these businesses to the continuing operations portfolio beginning in the fourth quarter is expected to be accretive to net sales, operating margin, earnings per share and operating cash flow in 2020 and future years.
- The company adjusted its segment structure to encompass the move of Rubbermaid Commercial Products to continuing operations. It will now report in four operating segments: Home & Outdoor Living, Learning & Development, Appliances & Cookware and Food & Commercial.
- On October 25, based on strong operating cash flow results, the company announced plans to redeem $300 million of 5 percent Senior Notes due 2023.
The normalized earnings of 73 cents compares to analysts’ consensus estimate of 55 cents. Revenues of $2.45 billion topped Wall Street’s consensus guidance of $2.43 billion.
Third Quarter 2019 Operating Results
Net sales were $2.5 billion, a 3.8 percent decline compared to the prior year period, largely attributable to the unfavorable impact of foreign exchange and a 2.5 percent decline in core sales.
Reported gross margin was 33.1 percent compared with 35.9 percent in the prior year period, as productivity and pricing were offset by headwinds from foreign exchange, tariffs and inflation, as well as a cumulative catch-up adjustment to recapture the depreciation attributable to the inclusion of Rubbermaid Commercial Products in continuing operations. Normalized gross margin was 35.1 percent compared with 35.5 percent in the prior year period.
The company recorded an $835 million non-cash impairment charge in continuing operations primarily related to impairment of trade names in the Appliances & Cookware, Home Fragrance and Outdoor & Recreation divisions.
The third quarter reported operating loss was $635 million compared with an operating loss of $7.8 billion in the prior year period, reflecting the impact of impairment charges in both years. Normalized operating income was $312 million compared with $337 million in the prior year period, reflecting lower sales volume and an increase in advertising and promotion expense, which offset the favorable impact from tight cost control and productivity efforts across the organization. Reported operating margin was a negative 25.9 percent compared with a negative 307.4 percent in the prior year. Normalized operating margin was 12.7 percent compared to 13.2 percent in the prior year period.
The company reported a tax benefit of $291 million compared with a benefit of $1.2 billion in the prior year period. The normalized tax benefit was $58.6 million compared with a benefit of $78.3 million in the prior year period.
The company reported a net loss of $626 million, or $1.48 diluted loss per share, compared with a net loss of $7.3 billion, or $15.52 diluted loss per share, in the prior year period.
Normalized net income for the total company was $309 million, or $0.73 diluted earnings per share, compared with $361 million, or $0.77 diluted earnings per share, in the prior year period.
Year-to-date operating cash flow was $424 million, compared with $182 million a year ago, reflecting strong progress on working capital initiatives partially offset by the foregone contribution from divested businesses.
An explanation of non-GAAP measures and a reconciliation of these non-GAAP results to comparable GAAP measures is included in the tables attached to this release. References to normalized results in the year ago period are based on normalized metrics that are adjusted to include Rubbermaid Commercial Products in continuing operations.
New Reporting Segments
In connection with the company’s decision to retain the Rubbermaid Commercial Products business, the company has realigned its management and segment reporting structure beginning in the third quarter of fiscal 2019. The company operates and reports financial and operating information in the following four segments:
Third Quarter 2019 Operating Segment Results
The Home & Outdoor Living segment generated net sales of $723 million compared with $727 million in the prior year period, as core sales growth of 1.3 percent was more than offset by the impact of unfavorable foreign exchange and the exit of 72 underperforming Yankee Candle retail stores in the first nine months of 2019. The Home Fragrance and Connected
Home & Security divisions posted positive core sales growth, which was partially offset by a core sales decline in Outdoor & Recreation. A reported operating loss of $181 million compared with a loss of $4.3 billion in the prior year period. Reported operating margin was a negative 25.0 percent versus a negative 591.9 percent in the prior year period. The improvement in operating loss and margin was primarily due to lower impairment charges in the current period compared to the prior period. Normalized operating income was $63.8 million compared with $82.5 million in the prior year period. Normalized operating margin was 8.8 percent compared with 11.4 percent in the prior year period.
The Learning & Development segment generated net sales of $824 million compared with $829 million in the prior year period, as core sales growth of 0.5 percent was offset by the headwind from foreign exchange. Core sales increased at both the Baby and Writing divisions. Reported operating income was $182 million compared with an operating loss of $159 million in the prior year period. Reported operating margin was 22.1 percent compared with a negative 19.2 percent in the prior year period. The increase in operating income and margin was primarily due to impairment charges recorded in the prior year period compared to none in the current period. Normalized operating income was $189 million versus $195 million in the year-ago period. Normalized operating margin was 23.0 percent compared with 23.5 percent in the prior year period due to higher advertising spend.
The Appliances & Cookware segment generated net sales of $430 million compared with $454 million in the prior year period, due to the impact of unfavorable foreign exchange and a core sales decrease of 3.7 percent. Reported operating loss of $595 million compared with a loss of $1.6 billion in the prior year period. Reported operating margin was a negative 138.3 percent compared with a negative 345.9 percent in the prior year period. The improvement in operating loss and margin was primarily due to lower impairment charges in the current period compared to the prior year period. Normalized operating income was $17.0 million versus $37.3 million in the prior year period. Normalized operating margin was 4.0 percent, compared with 8.2 percent in the prior year period.
The Food & Commercial segment generated net sales of $473 million compared with $539 million in the year ago period, reflecting a core sales decline of 11.3 percent and a headwind from foreign exchange. Reported operating income of $32.8 million compared with a loss of $1.7 billion in the prior year period. Reported operating margin of 6.9 percent compared with a negative 314.7 percent in the year ago period. The increase in operating income and margin was primarily due to impairment charges recorded in the prior year period compared to none in the current period. Normalized operating income was $89.9 million versus $106.5 million in the prior year period. Normalized operating margin was 19.0 percent compared with 19.7 percent in the prior year period.
Strategic Changes to Continuing Portfolio
The company announced its decision to end its divestiture program and retain the Mapa/Spontex and Quickie businesses, which had been classified as held for sale and discontinued operations through the third quarter of 2019. Beginning in the fourth quarter, the financial results of the Mapa/Spontex and Quickie businesses will be reflected in continuing operations. The retention of these businesses is expected to be accretive to net sales, operating margins, earnings per share and operating cash flow in 2020 and future years.
U.S. Playing Cards, currently under contract to be sold, will continue to be reflected in discontinued operations until the closing of the transaction, which is still expected to be completed by year-end 2019, subject to customary closing conditions, including regulatory approvals. The company now expects to achieve a net debt to EBITDA leverage ratio of approximately 4x by the end of 2019, and to approach 3.5x by the end of 2020.
The company’s outlook for full year and fourth quarter net sales, core sales, normalized operating margin and normalized earnings per share have been updated to reflect the inclusion of the Mapa/Spontex and Quickie businesses as part of continuing operations beginning in the fourth quarter. In the interest of comparability, the company has provided an adjusted view of its full year 2018 and Q4 2018 normalized financial results as they would have appeared had Mapa/Spontex and Quickie been part of continuing operations in those periods. This adjusted information can be found in the appendix to this press release and in the Investors section of the company’s website, www.newellbrands.com. As a result of the move to continuing operations, the company will resume depreciation expense for the Mapa/Spontex and Quickie businesses, with the annualized impact estimated at approximately $10 million. (Under GAAP, assets held for sale are not depreciated.) Since the company’s previous guidance assumed the Mapa/Spontex and Quickie businesses would be divested at year-end 2019, the incremental depreciation expense is the only incremental impact on the outlook for full year normalized earnings per share; the outlook for operating cash flow is not impacted by this change.
Executive Appointment
On October 9, 2019, Steve Parsons joined Newell Brands Inc. as Chief Human Resources Officer. Parsons joined the Company from Z Capital Partners, the private equity fund management arm of Z Capital Group, where he served as Global Operating Partner, Human Capital since 2016. He has extensive human resources leadership experience in public and private companies across the consumer products, manufacturing, healthcare, service and retail industries, including prior service as Chief Human Resources Officer at Stage Stores, Inc. from 2014 to 2016 and as Global Chief Human Resources Officer at OfficeMax from 2011 to 2014.
Newell Brands’ brands include Paper Mate®, Sharpie®, Dymo®, EXPO®, Parker®, Elmer’s®, Coleman®, Marmot®, Oster®, Sunbeam®, FoodSaver®, Mr. Coffee®, Rubbermaid Commercial Products®, Graco®, Baby Jogger®, NUK®, Calphalon®, Rubbermaid®, Contigo®, First Alert® and Yankee Candle®.
Outlook for Full Year and Fourth Quarter 2019
The company updated its full year outlook and initiated its fourth quarter outlook as follows:
