
Life Time Group Holdings, Inc. reported second quarter revenue increased 18.9 percent year-over-year to $667.8 million, which was attributed to continued growth in membership dues and in-center revenue, and driven by an increase in average dues, membership growth in its new and ramping centers, and higher member use of its in-center offerings.
- Center memberships increased by 42,398, or 5.4 percent, compared to June 30, 2023, and increased sequentially from March 31, 2024, by 30,626, partly due to seasonality.
- Total subscriptions, including center memberships and digital on-hold memberships, increased 5.5 percent to 878,767 compared to June 30, 2023.
Center operations expenses increased 17.5 percent year-over-year to $355.5 million, said to be primarily due to increased operating costs related to its new and ramping centers and from growth in memberships and in-center business revenue.
General, administrative, and marketing expenses increased 0.8 percent year-over-year to $53.2 million, primarily due to increased cash incentive compensation expenses, IT costs, and center support overhead to enhance and broaden member services and experiences. These expenses were also partially offset by lower share-based compensation expenses.
Net income increased $35.8 million to $52.8 million in Q2, which the company said was primarily due to improved business performance and, to a lesser extent, tax-effected one-time net benefits of $6.0 million from net gains on sale-leaseback transactions and $3.4 million from a gain on the sale of land in the current year period, as compared to a tax-effected one-time loss of $6.2 million on a sale-leaseback transaction in the prior year period.
- Adjusted net income increased $14.4 million to $52.4 million.
Adjusted net income and Adjusted EBITDA improved as the company saw greater flow through its increased revenue and benefited from the structural improvements to its business that improved margins.
Bahram Akradi, Founder, Chairman and CEO, stated, “We are very pleased with our second quarter performance and the progress we have made toward achieving our financial objectives. Once again, this quarter, our results demonstrate the momentum of our business as we continue to deliver strong revenue and adjusted EBITDA growth. The second quarter was also an important inflection point for the company as we achieved positive free cash flow as expected and a net debt leverage ratio of 3.0 times, which was two quarters earlier than our plan. As a result of our strong performance, we are raising our full-year revenue and adjusted EBITDA guidance. We are enthusiastic about the trajectory of our business and remain committed to funding our growth while generating positive free cash flow and further reducing our leverage.”
Six-Month 2024 Overview
- Revenue increased 17.9 percent to $1.26 billion from continued growth in membership dues and in-center revenue, driven by an increase in average dues, membership growth in its new and ramping centers, and higher member use of its in-center offerings.
- Center operations expenses increased 17.5 percent to $677.4 million primarily due to increased operating costs related to its new and ramping centers and from growth in memberships and in-center business revenue.
- General, administrative and marketing expenses increased 7.1 percent to $102.1 million primarily due to increased cash incentive compensation expenses, IT costs, and center support overhead to enhance and broaden member services and experiences. These expenses were also partially offset by lower share-based compensation expenses.
- Net income increased $33.2 million to $77.7 million primarily due to improved business performance and, to a lesser extent, tax-effected one-time net benefits of $5.8 million from net gains on sale-leaseback transactions and $3.3 million from a gain on the sale of land in the current year period. Net income in the prior year period included a tax-effected one-time gain of $3.8 million on the sale of two triathlon events and a tax-effected one-time net loss of $0.6 million on sale-leaseback transactions.
- Adjusted net income increased $23.6 million to $83.4 million.
- Adjusted net income and Adjusted EBITDA improved as the company saw greater flow through its increased revenue and benefited from the structural improvements to its business that improved margins.
New Center Openings
- Life Time opened three new centers during the second quarter.
- As of June 30, 2024, the company operated 175 centers.
Cash Flow Highlights
- Net cash provided by operating activities of $170.4 million increased 20.1 percent compared to the prior year quarter.
- Life Time achieved free cash flow of $175.1 million, including $149.0 million of proceeds from sale-leaseback transactions and land sales.
Capital Expenditures By Type
(Liquidity and Capital Resources)
- As of June 30, 2024, total available liquidity was $413.6 million, which included availability on its revolving credit facility and cash and cash equivalents;
- Net debt leverage ratio improved to 3.0x as of June 30, 2024, from 4.3x as of June 30, 2023;
- Completion of sale-leaseback transactions on four properties for net proceeds of $142.7 million; and
- Paid down $169.2 million of debt.
Full-Year 2024 Guidance
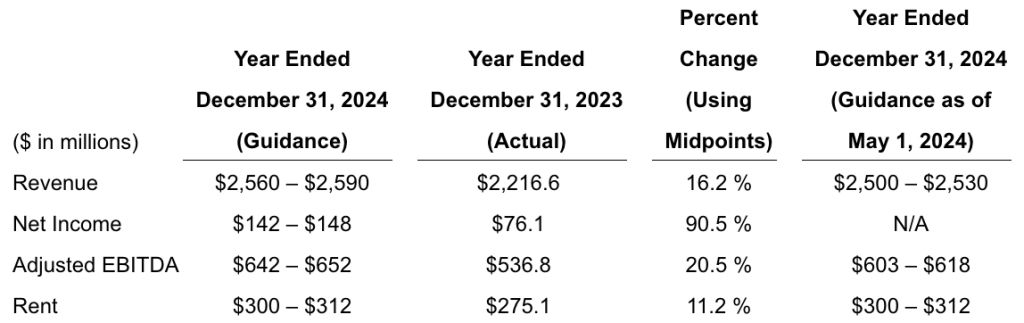
Images and data tables courtesy Life Time Group Holdings, Inc.