There was some good news and worrisome news in SFIA’s 2017 Sports, Fitness and Leisure Activities Topline Report.
On the positive side, most sport categories saw an increase in participation, with fitness sports and team sports having the most gains. With the help of camping, outdoor sports saw a modest increase over the last year, regaining momentum since a drop in 2014.
However, in many activities, casual participation rates are rising faster than core rates, suggesting Americans may be sampling more sports while reducing single-minded devotion to any one activity. In some cases, increases in casual participation may be the direct result of sport governing bodies and organizations dedicating efforts to “grow their game” through grassroots outreach and hands-on opportunities.
“There is good news for several sports, but just as many sports are seeing declines,” said Tom Cove, SFIA president and CEO. “It’s clear we need to continue to do everything we can to engage young people in sports and fitness through fun and healthy experiences.”
He added, “Americans love to try new activities and it’s encouraging to see positive growth rates for such a wide variety of athletic options, but at the same time, reduced levels of core participation have to be a real concern for our industry. It’s important to transform some of today’s casual participants into tomorrow’s core athletes.”
Most categories saw slower gains in core than casual participation with some showing drops in core alongside gains in casual participation.
Among the sports seeing healthier gains in core versus casual participants were a number of fitness-oriented activities, including yoga, cross training, bodyweight exercise & bodyweight accessory-assisted training, weight/resistance machines, treadmill and kettlebells. Others seeing higher growth in core versus casual participation included adventure racing, field hockey, volleyball (grass), target shooting (rifle) and mixed martial arts for competition.
Tackle Football Basketball And Outdoor Soccer See Participation Declines
Among team sports, some sports were clearly helped by the Rio Olympics and a few niche sports continue to see momentum in participation. But many of the traditional team sports showed net participation declines.
Football (tackle) was down 11.9 percent. Casual participation tumbled 21.1 percent and core was off 4.2 percent. On a brighter note, core participation between the ages of 6 to 17 was basically flat, up 0.1 percent. Overall, core participation in football (tackle) is down 2.4 percent among 6-to-17 year olds and 2.9 percent on average overall over the past five years.
Football (touch) was down 12.3 percent with similar declines in both casual and core participation. One positive finding was football (flag), which grew 5.9 percent overall. Core participants in flag football grew 9.8 percent among 6-to-17 year olds and increased 7.3 percent overall.
Basketball was down 4.6 percent after seeing a slight gain in 2015. Core participation was down 5.0 percent and is down 2.2 percent on average over the past five years.
Soccer (outdoor) lost 5.6 percent. Core participation was down 6.0 percent and has been sliding for several years. Faring better was soccer (indoor), rising 6.3 percent overall and gaining 4.3 percent in core participation. Participants are only a third of outdoor participants.
Baseball was ahead 7.7 percent overall, led by an 18.1 percent gain in casual participation (one to 12 times a year). Marking a rebound, core participation in baseball increased 2.0 percent. Core participation is off 0.5 percent over the last five years.
Softball (slow-pitch) was up 8.1 percent with a 5 percent gain in core. Softball (fast pitch) was nearly flat, up 0.3 percent.
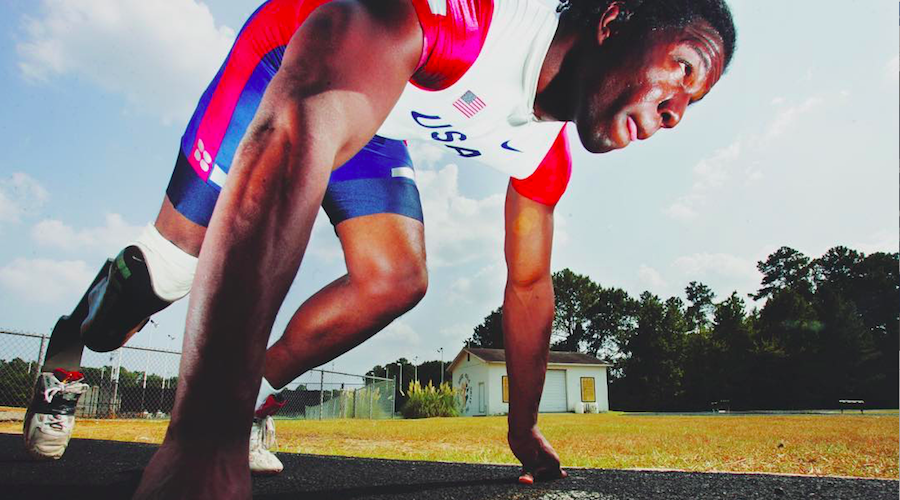
Among other classic school sports, track & field was down 2.5 percent. Core track & field participation was down 4.2 percent to mark its second straight yearly drop. Wrestling was down 2.9 percent, with core down 11.6 percent
Ice hockey was up 5.9 percent, led by an 11.0 percent gain in casual participation. Core participation saw a 1.3 percent lift.
Rio Olympics Fuel Team Sports Gains
Among the team sports receiving an Olympic boost were gymnastics, which jumped 15.0 percent with healthy gains seen in both casual, 17.0 percent; and core, 11.3 percent. Core participants in gymnastics were still off on average by 0.2 percent over the last five years.
Swimming on a team participation grew 16.5 percent, with core ahead 5.5 percent and casual jumping 26.9 percent.
Particularly helped by the Rio location, volleyball (beach/sand) ran ahead 14.7 percent, with a 19.2 percent gain in casual play along with a solid 4.3 percent gain in core players (more than 13 times a year). Volleyball (grass) jumped 10.5 percent in participants, led by a 14.2 percent gain with core. Volleyball (court), however, was down 3.2 percent with a 5.9 percent drop in core players.
Cheerleading continued to see strong gains, climbing 11.7 percent. The gains continue to be led by casual participation, which saw a 20.1 percent gain. Core participation (more than 26 times a year) was up only 1.5 percent, matching its five-year average.
Among niche team sports, rugby remains the hottest. Rugby expanded 14.9 percent, led by an 18.7 percent gain in casual participation although core participants (more than 8 times) was still ahead a strong 6.8 percent. Core participation in the sport has grown 8.8 percent on average over the past five years.
Lacrosse, after years of steady growth, eased 0.2 percent in participation. Core participation was down 1.0 percent. Over the past five years, lacrosse participation has grown 3.6 percent.
Field hockey lost 3.4 percent overall but core participation was ahead 0.7 percent and overall core participation in field hockey is up 4.0 percent on average over the past five years.
Also included in team sports, ultimate Frisbee participation was off 16.7 percent. Roller hockey grew participation by 1.2 percent, but slowed from its five-year average of 10.0 percent. Paintball bounced back, rising 9.5 percent in participation last year.
Overall, team sports added 2 percent from 2015 and averaged a 5 percent increase over the last three years., mainly influenced by the niche sports, such as rugby and gymnastics, gaining popularity.
Camping, Climbing And Day Hiking Pace Outdoor Sports Gains
Climbing (sport/indoor/boulder) rose 4.7 percent and is now ahead 2.1 percent on average over the last five years. Participation in climbing (traditional/ice/mountaineering) jumped 8.5 percent and is ahead 8.0 percent on average over the last five years
Hiking (day) participation ran ahead 13.2 percent, well above its average of 4.8 percent over the past five years. Conversely, backpacking overnight (more than 1/4 mile from vehicle/home) slowed to a 0.5 percent increase but is still ahead 5.8 percent on average over the past five years.
Camping (recreational vehicle) was ahead 7.9 percent, making up for declines in recent years. Core camping (more than 8 times a year) even saw a gain of 4.1 percent albeit still off 0.4 percent on average over the last five years. Camping within 1/4 mile of vehicle/home was down 4.6 percent.
Among cycling activities, bicycling (BMX) continued to be the bright sport, gaining 15.4 percent overall with core participants ahead 9.0 percent.
Bicycling (road/paved surface) inched up 0.2 percent. But core participation (more than 26 times a year) was down 1.6 percent and is now off 3.7 percent over the last three years on average. Bicycling (mountain/non-paved surface) was up 3.6 percent overall but again off 2.5 percent in core participants.
Fly Fishing Tops Hunt/Fish Sports Gains
Among hunt/fish sports, fishing (fly) led the fish side, ahead 6.0 percent year-over-year. Fishing (freshwater/other) was ahead 1.2 percent while fishing (saltwater) was ahead 2.4 percent. The latter two activities each picked up over recent years.
In the hunt category, hunting (rifle) was basically flat, up 0.2 percent and is now ahead 0.7 percent over the last five years. Among core participants, hunting (rifle) slipped 0.7 percent and is off 1.8 percent on average over the last five years.
Hunting (bow) saw participation dip 3 percent but the activity is still up modestly over the last five years. Hunting (shotgun) lost 2.0 percent, reversing some gains seen in recent years.
Shooting (sport clays) was up 2.0 percent although core participants (more than 8 times a year) declined 8.8 percent. Shooting (trap/skeet) gained 5.3 percent while Target shooting (handgun) moved up 2.9 percent.
Rafting, Canoeing And Jet Skiing Declines Sink Water Sports
Among water sports, the star continues to be stand up paddling, with a 6.6 percent gain in overall participation last year although the growth has slowed. Over the last five years, participation in stand up padding has climbed 23.8 percent.
Kayaking (recreational) was another bright spot, ahead 5.5 percent overall last year, tracking a similar growth rate as seen in recent years.
Surfing participation was up 3.4 percent, a pickup over more modest gains seen in recent years. Core participants (more than 8 times a year) were down 1.2 percent.
The biggest decline in water sports activities came in rafting, losing 11.7 percent in participants last year after showing a small gain in 2015. Canoeing participation was off 1.9 percent while participation in jet skiing dropped 7.7 percent. Scuba diving was down 5.0 percent with core participation (more than 8 times a year) sliding 5.8 percent. Snorkeling was off 1.8 percent with core participants declining 5.3 percent. Overall, water sports saw the greatest loss among activity categories with a 3 percent decrease.
In racket sports, participation in tennis moved up 0.6 percent and has steadily shown modest gains in recent years. Racquetball participation, however, was down 7.8 percent and is down 3.8 percent on average over the past five years. Even worse, squash lost 9.5 percent although core participation expand. Participation in table tennis was flat overall while badminton gained 2.2 percent.
Over the last five years, racquet sports steadily increased 3 percent on average, largely driven by cardio tennis and squash.
Trail Running And Adventure Racing Lead Individual Sports
Among individual sports, a highlight was trail running participation, which grew 5.4 percent in 2016 and is now ahead 9.9 percent on average over the past five years. Adventure racing picked up 4.7 percent, fueled by a 10.1 percent hike in core participants (more than 2 times a year).
Triathlons appears to be losing some ground after seeing strong gains in recent years. Triathlon (non-traditional/off road) participation was off 2.2 percent but was still up 16.7 percent on average over the past five years. Core participants were down 8.4 percent last year. Triathlon (traditional/road) was down 5.0 percent overall with core down 8.4 percent.
Martial arts’ participation grew 4.3 percent but participation in mixed martial arts for fitness fell 6.4 percent. Boxing for fitness participation was off 4.5 percent.
Roller skating (2×2 wheels) was down 2.2 percent while roller skating (inline wheels) dropped 10.7 percent. Skateboarding was essentially flat, up 0.1 percent, but core participation was down 3.2 percent.
Archery participation was down 5.7 percent but is still ahead 4.3 percent over five years on average. Ice skating participation was down 1.6 percent
Cross-Training, Aquatic And High Intensity Training Lead Aerobic Exercise
Fitness sports increased 2 percent overall over the last year. Cross-training, aquatic exercise and high impact/intensity & training stood out on the upside among aerobic activities.
Participation in cross-training style workouts grew 10.3 percent with core participation (50 times a year) running even higher, ahead 14.3 percent. Casual participation was up 6.5 percent.
Aquatic exercise participation jumped 14.6 percent, well above the 3.4 percent rate seen on average over the last five years. Core participation in aquatic exercise was up 6.3 percent.
High impact/intensity & training participation was ahead 4.5 percent, led by a 9.7 percent climb in core participation (more than 50 times a year). Over the past five years high impact/intensity & training participation has grown 2.8 percent.
Participation in dance, step, and other choreographed exercise to music was up 1.6 percent, supported by a 4.5 percent lift in core participation.
Boot camp style training participation was down 2.1 percent with core participation losing 6.0 percent. Cardio kickboxing was ahead 2.8 percent in participation but core participation eased 0.5 percent.
Running/jogging participation overall was down 2.3 percent and is now down 1.0 percent over the last five years on average. Core participants were down 4.9 percent, representing its third year of declines.
In the gym, stair climbing machine participation was the stand out, jumping 13.9 percent. Treadmill participation advanced 2.9 percent, representing a comeback. Core treadmill participation (more than 50 times a year) grew 4.1 percent but is still down 1.4 percent on average over the last five years.
Other participation gains in aerobic activities were seen by stationary cycling (group), up 3.0 percent; stationary cycling (recumbent/upright), up 1.6 percent; and swimming for fitness, ahead 1.1 percent. Declines were seen elliptical motion trainer/cross-trainer, losing 0.3 percent; and walking for fitness, off 1.8 percent.
Yoga Sees Continued Gains
Among conditioning activities in fitness sports, participation in yoga grew 3.9 percent. Core participants in yoga was ahead 4.3 percent, gaining on its five-year average of 2.5 percent.
Pilates training participation was up 3.5 percent but core participation slid 0.8 percent. Barre participation was down 7.1 percent with core participation off 1.3 percent. Tai Chi participation was up 1.5 percent. Rowing machine participation grew 7.2 percent.
Among strength activities in fitness sports, the biggest participation gainer was free weights (barbells), ahead 4.3 percent. Weight/resistance machines moved up 1.3 percent. Participation in free weights (dumbbells/hand weights) was down 5.9 percent. Kettlebells participation grew 3.2 percent, led by a 12.2 hike in core.
Overall activity for 2016 had a favorable year with 42 percent of the population ages 6 and over participating at least once a week in a high calorie burning activity. Although active to a healthy level saw more participants, low to medium calorie burning activities saw a decrease in participation.
Inactivity in 2016 saw a modest drop, losing 100,000, a 0.2 percent decrease, and maintaining a 27 percent rate, partly because of the population increase. Although the last five years has remained relatively flat, on average, there appeared to be some momentum in the decline of inactivity. This decline was shown throughout all age segments, with only those ages 45 to 54 remaining flat. However, this was not true for income levels, where lower income households (less than 50K) saw an increase in inactivity and households with an income of 50K or more saw a slight decrease in inactivity.
The 2017 Sports, Fitness, and Leisure Activities Topline Participation Report is available for download at www.sfia.org/reports. The report is free of charge to all SFIA members and is available for purchase by other interested parties.
Photo courtesy National Federation of State High School Associations (NFHS)


