
Hibbett, Inc. reported net sales increased 1.8 percent to $466.6 million for the 14-week fourth quarter ended February 3, compared with $458.3 million for the 13-week Q4 period ended January 28, 2023. Comparable sales declined 6.4 percent versus the equivalent 13-weeks in the prior year.
Brick-and-mortar comparable sales declined 9.2 percent, while e-commerce increased 6.9 percent year-over-year, excluding the impact of the 14th week. E-commerce represented 18.9 percent of total net sales for the Fiscal 2024 Q4 period, compared to 17.4 percent in the Fiscal 2023 Q4 period.
Gross margin was 34.5 percent of net sales for the latest quarter, compared with 35.2 percent of net sales for the Fiscal 2023 Q4 period. The approximate 70 basis-point decline was said to be primarily due to a lower average product margin of approximately 125 basis points and an approximate 55 basis-point increase in store occupancy costs. Freight, shipping, logistics costs and shrink have improved as a percent of sales on a year-over-year basis, partially offsetting the unfavorable average product margin and store occupancy performance. Freight was favorable by approximately 65 basis points, logistics was favorable by approximately 30 basis points and shrink was favorable by approximately 15 basis points.
Store operating, selling and administrative (SG&A) expenses were 23.0 percent of net sales for the fourth quarter, compared with 21.6 percent of net sales for the Fiscal 2023 Q4 period. The increase of approximately 140 basis points is primarily the result of the inflationary impact on store wages and the related benefit costs, a growing store base and increased data processing costs associated with the ongoing investment in cloud-based back-office systems and technology.
Net income for the fourth quarter was $30.9 million, or $2.55 per diluted share, compared to $38.4 million, or $2.91 per diluted share, for the Fiscal 2023 Q4 period.
During the fourth quarter, Hibbett opened 14 new stores and closed three stores, bringing the store base to 1,169 doors in 36 states as of February 3, 2024.
The retailer ended the fourth quarter of Fiscal 2024 with $21.2 million of available cash and cash equivalents on the unaudited condensed consolidated balance sheet and $45.3 million of debt outstanding.
Inventory at quarter-end was $344.3 million, an 18.2 percent decrease compared to the prior-year fourth quarter.
During the fourth quarter, the company paid a quarterly dividend equal to 25 cents per outstanding common share, resulting in a cash outlay of $2.9 million.
Capital expenditures during the fourth quarter were $20.7 million compared to $15.4 million in the Fiscal 2023 Q4 period.
“We are pleased to report a solid financial performance for the fourth quarter of Fiscal 2024, as we continued to execute our strategy in a dynamic and challenging retail environment,” commented Mike Longo, president and CEO of Hibbett, Inc. “Notably, we finished the year with $1.73 billion in sales, a new full fiscal year record for Hibbett. Our sales performance for the fourth quarter reflects the busy holiday selling season, which was in line with our expectations. During the quarter, we also benefited from new product launches and a favorable customer response for our popular footwear brands. The fourth quarter also benefited from our integrated Hibbett Rewards X Nike Membership, which brings together the Hibbett and Nike loyalty programs and supports sales growth across all retail channels. This loyalty partnership will provide exclusive shopping experiences, personalized content, and early access to the latest product launches for our Connected members.”
Fiscal 2024 Year Results
Net sales for the 53-week fiscal year ended February 3 increased 1.2 percent to $1.73 billion compared with $1.71 billion for the 52-week fiscal year ended January 28, 2023.
Comparable sales decreased 3.1 percent for the year versus the equivalent 52-weeks in the prior year. Brick and mortar comparable sales declined 4.4 percent and e-commerce sales increased 4.1 percent, excluding the impact of the 53rd week. E-commerce represented 16.2 percent of total net sales in the 2023 fiscal year, compared to 15.6 percent in the 2022 fiscal year.
Gross margin was 33.8 percent of net sales for the fiscal year, compared with 35.2 percent of net sales for the 2022 fiscal year. The approximate 140 basis-point decline was said to be primarily due to a lower average product margin of approximately 210 basis points and an approximate 40 basis-point increase in store occupancy costs. Freight, shipping, logistics costs and shrink have improved as a percentage of sales on a year-over-year basis, partially offsetting the unfavorable average product margin and store occupancy performance. Freight was favorable by approximately 70 basis points, logistics was favorable by approximately 30 basis points and shrink was favorable by approximately 10 basis points.
SG&A expenses were 23.0 percent of net sales for the fiscal year, compared with 22.8 percent of net sales for the 2022 fiscal year. The approximate 20 basis point increase was primarily the result of increased store wages and data processing costs partially offset by lower professional fees and advertising.
Net income for the fiscal year was $103.2 million, or $8.17 per diluted share, compared to $128.1 million, or $9.62 per diluted share, for the 2022 fiscal year.
During the fiscal year, the company repurchased 1.2 million shares of common stock for a total expenditure of $56.1 million, including 47,550 shares acquired from employee holders of RSUs to satisfy tax withholding requirements of $2.8 million. The company also paid recurring quarterly dividends, resulting in a cash outlay of $12.4 million.
Capital expenditures during the fiscal year were $57.9 million, compared to $62.8 million in the 2022 fiscal year. Fiscal year capital expenditures were predominantly related to store initiatives, including new store openings, relocations, expansions, remodels and capital associated with general maintenance of our facilities.
Extra Week Effect
Total net product sales for the 53rd week of the last fiscal year were approximately $22.9 million. The extra week increased the fourth quarter and full-year net income by an estimated $2.6 to $2.8 million; this translates to an approximate diluted EPS range of 21 cents to 23 cents for the fourth quarter and 21 cents to 22 cents for the full year. In addition, during the fourth quarter, Hibbett recorded a $3.5 million increase in revenue due to a change in the estimate of gift card breakage. This change was supported by the historical redemption pattern of gift cards outstanding and contributed 23 cents and 22 cents of diluted EPS to the fourth quarter and full year, respectively.
“As we continue to extend our market reach, we believe Hibbett is building momentum, and our sales guidance for the year ahead reflects this confidence,” said Longo. “In Fiscal 2025, we plan to continue to make significant investments in our store footprint, customer-facing technologies, and back-office infrastructure. This will impact our profitability growth in the short term but will enhance our value proposition and profitability over the longer term. We remain focused on providing a unique and compelling product assortment supported by our omni-channel platform capabilities and exceptional customer service that allows us to serve our customers wherever and whenever they decide to shop. We look forward to opportunities to continue expanding our Hibbett and City Gear brands while delivering greater value to our customers and shareholders.”
Full Year Fiscal 2025 Outlook
Fiscal year ending February 1, 2025 (Fiscal 2025) will have 52 weeks versus 53 weeks in Fiscal 2024. The company said several business and economic challenges it faced in Fiscal 2024 would continue to impact the business in Fiscal 2025. These challenges include the potential for inflation and interest rates to remain elevated, the continued use of promotional activity to drive traffic, ongoing wage pressures, a more cautious and selective consumer, and ongoing geopolitical conflicts. These factors contribute to the complexity and volatility in forecasting Fiscal 2025 results.
Considering the factors noted above, Hibbett provided the following overview of estimated results for Fiscal 2025.
Sales Guidance
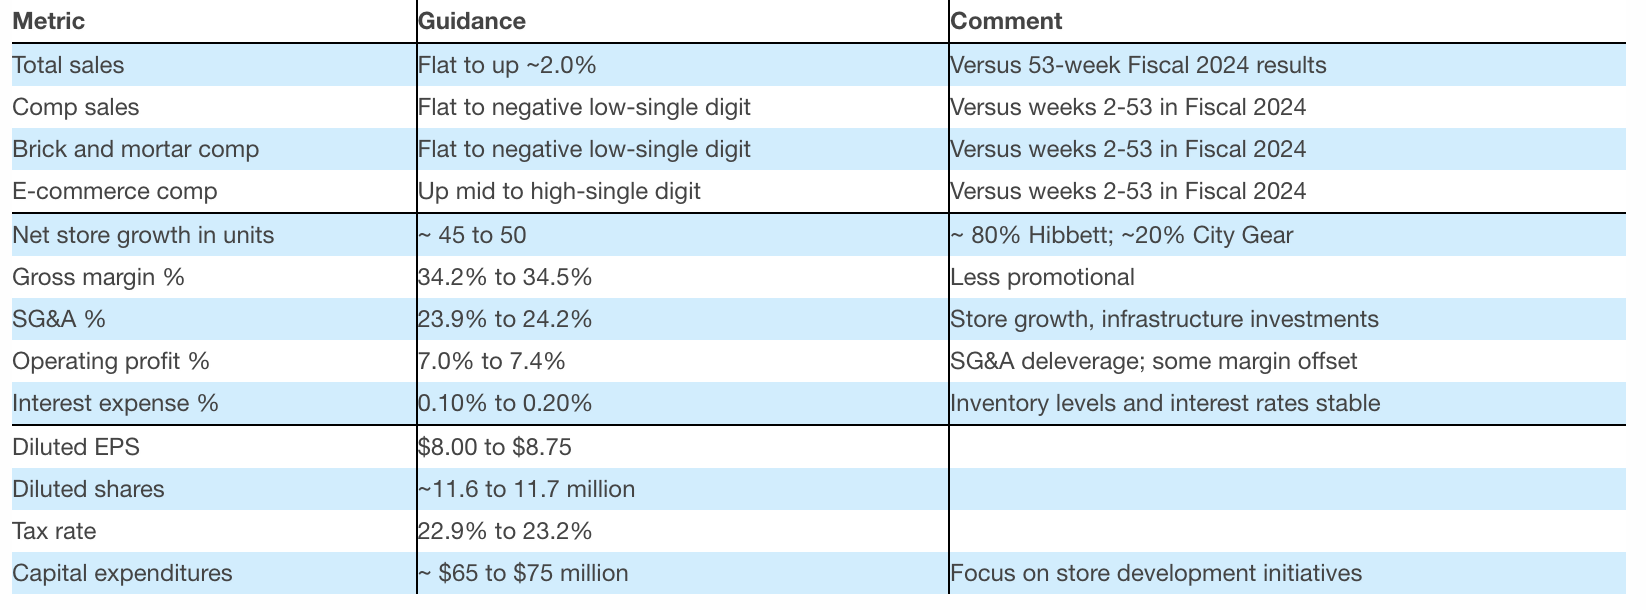
- Total net sales in Fiscal 2025 are anticipated to be flat, up to approximately 2.0 percent, compared to the full-year fiscal 2024 results.
- Due to the transition from a 53-week year in Fiscal 2024 to a 52-week year in Fiscal 2025, comparable sales for Fiscal 2025 will be compared to weeks two through 53 in Fiscal 2024.
- Comparable sales are expected to be flat to down in the low-single- digit range for the year.
- Brick-and-mortar comparable sales are expected to range from flat to negative low-single digits.
- Both total e-commerce revenue and comparable e-commerce revenue is anticipated to be up in the mid- to high-single-digit range.
- Net new store growth is expected to be approximately 45 to 50 units. The first quarter is projected to have the lowest growth, with net new units anticipated to be more evenly distributed across the remaining three quarters.
Additional Guidance Commentary
- Gross margin expectations include a less impactful promotional environment and small leverage gains in freight and logistics partially offset by headwinds in store occupancy. These factors are expected to drive approximately 40 to 70 basis points of improvement in the gross profit percentage in comparison to Fiscal 2024 results. Expected full year gross margin is anticipated to be in the range of 34.2 percent to 34.5 percent of net sales.
- SG&A as a percent of net sales is expected to increase by approximately 90 to 120 basis points in comparison to Fiscal 2024 results due to new store growth, wage inflation and increased incentive compensation, transaction fees and data processing costs, including incremental investment in cloud-based technology solutions. The expected full year SG&A expense range is estimated to be 23.9 percent to 24.2 percent of net sales.
- Operating profit is expected to be in the range of 7.0 percent to 7.4 percent of net sales, a decline of approximately 50 to 90 basis points in comparison to Fiscal 2024 results.
- The company anticipates there will be debt outstanding under the line of credit for the majority of the year. Hibbett believes peak borrowings will be tied closely to the timing of receipts leading up to the peak selling seasons. Interest expense for the full year is projected to be approximately 10 to 20 basis points of net sales.
- Diluted earnings per share are anticipated to be in the range of $8.00 to $8.75 using an estimated full year tax rate of between 22.9 percent and 23.2 percent and an estimated weighted average diluted share count of approximately 11.6 to 11.7 million.
- Capital expenditures are anticipated to be in the range of $65 million to $75 million, with the largest share of this investment focused on new store growth, remodels, relocations, new store signage, and improving the consumer experience.
- Hibbett’s capital allocation strategy continues to include share repurchases and recurring quarterly dividends in addition to capital expenditures.
HIBB shares were down in double digits in pre-market trading on Friday after a small miss on Q4 EPS and a bigger miss on Fiscal 2025 forecasted EPS. The pre-market decline was cut in half after the company’s conference cal with analysts.
Image courtesy Hibbett, Inc.


