Unlike most recessionary periods in years past, the active sports lifestyle market is shifting with the rest of the economy as consumers adjust buying and living habits to offset the rising cost of energy and food, as well as the aftershocks of the sub-prime mortgage mess. The 2008 “How America Shops” study, developed by The SportsOneSource Group, measures the factors that influence where consumers shop and what drives them to buy. The report found that price has become the number one motivating factor in determining where consumers shop for sporting goods or athletic footwear and apparel.
The study, which also includes the annual Retail Report Card for the active sports lifestyle market, was based on a survey conducted via the Internet in June 2008, and sampled a cross-section of the American population ages 18 to 65 that had purchased sporting goods, athletic footwear, or athletic apparel in the past 12 months. Approximately 55 percent of the respondents were female and 45 percent were male. The mean age of the respondents was 44.1.
The use of the Internet as a survey vehicle skews the demographics to be a bit more white, educated and affluent, which makes the emphasis on price all the more intriguing. The fact that women once again comprised the majority of respondents makes the list of retailers receiving top honors even more interesting.
Based on the SOS survey, 83 percent of respondents said that price was an extremely or somewhat important reason for visiting or shopping a particular retail store. Product availability ranked a close second at 80 percent of the total survey group. Location was third at 79 percent, while an informed, helpful staff was cited by 73 percent of the respondents. A stores image or reputation was the fifth most-cited reason by 58 percent of the total respondents, underscoring its importance in their decision.
All of this indicates a real shift from the SGB “How America Shops” study published in November 2003, when availability of needed product and in-stock items were the top reasons consumers cited for why they chose to shop a particular retail location. Price was the third most important reason given five years ago, but the percentage of respondents citing price as a driver in their decision on where to shop was still high at 81 percent of total responses. Location was down at the number six reason five years ago, cited by 66 percent of the respondents as important to their decision on where to shop.
The other big change-again, not so surprising-is that 78 percent of respondents used the Internet to research product, up from approximately 56 percent five years ago. The key take-way here is that the consumer today expects to see both price and product-at their convenience.
Looking inside the numbers, retailers can also assess how to best market to target consumers. For instance, women placed much more importance on price than men as an influence on where to shop for sporting goods products. Roughly 73 percent of the female respondents cited price as “extremely important,” whereas 67 percent of the male respondents gave it the same importance. Women were also influenced more heavily by product availability than men, 71 percent versus 63 percent, respectively. In terms of location, 54 percent of women indicated that the convenience of a store was “extremely important,” compared to 45 percent of the men that responded to the survey.
Retailers had better have a well-informed staff on the floor to service their female customers, as well, since nearly half of the women surveyed cited good service and an informed, helpful staff as key to their shopping decisions-a full 10 points higher than their male counterparts.
Also not surprising was data showing that older respondents regarded price and product availability as more important than did younger respondents. The price influence was clearly driven by lower income earners responding to the survey. Respondents with household incomes under $60,000 comprised 37 percent of the survey base responding to the income question, and that segment was the only income group that ranked price higher than product availability as “extremely important” to their decisions on where to shop for sporting goods. Predictably, the lower the income, the higher the response rate for price as a key driver in decisions. Product availability and price ran about even for the $60,000 to $80,000 household income group as well as the $80,000 to $100,000 group, but product availability as a key driver moved past price once household incomes surpassed the six-figure mark.
Location of store and quality of service exhibited a bell curve effect across the household income spectrum, scoring higher in the middle-income groups and lower with lower- and higher-income families.
There were some clear differences by region, as well, with price receiving the most emphasis in the Midwest, Rockies and California. Price and product availability ran about even in the Northeast and Northwest, and product availability was cited most often as “extremely important” in the Southeast and Southwest.
When it comes to the actual purchase of sporting goods at a particular store, price was the clear influencer, at about the same rate as the 2003 survey conducted by Nielsen Media Research for SGB. The stores return policy was the second most mentioned reason to buy at 54 percent. Clear display of items was third, with 51 percent of the total respondents suggesting it as a key influence on buying decisions, but items clearly displayed came in second when respondents were asked if the reason to buy had “some effect” on the decision. A knowledgeable sales staff and the ability to use, demo or try on product rounded out the top five reasons for purchasing at a particular store. This result correlates pretty closely to the retailers receiving the highest scores overall in the study.
Price was again more important to female respondents, and the return policy of the store was clearly a bigger deal for women than for men, with 61 percent of women suggesting that it was “extremely important,” compared with only 52 percent of men. The only influence that men placed more importance on than women was the subject of warranties available on products. (The full report breaks out these responses in much more detail across demographics and can be broken further on request.)
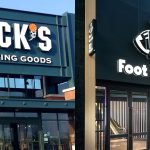
In terms of specific retailers, Foot Locker was cited as the most recognized retail brand name by the surveys respondents, followed by Dicks Sporting Goods, The Sports Authority, Lady Foot Locker and Bass Pro Shops. As expected, the retail brand name recognition shifted a bit by region, with Foot Locker ranking the highest in all regions except California and the Northwest, where Big 5 Sporting Goods was cited the most often and Foot Locker slipped to the number two spot. Dicks Sporting Goods had a higher recognition ranking in the Northeast than its national average (88 percent in the Northeast versus 72 percent nationally), and also scored stronger in the Midwest. The Sports Authority still ranked higher for brand recognition in the Southeast (76 percent), Southwest (75 percent), and Rocky Mountains (81 percent), snagging the second spot in each of those regions, and the Northeast (77 percent), where it had the number three spot. Bass Pro Shops and Cabelas traded back and forth for the top five spots in most regions-with the exception of California, the Northwest and Northeast-and both made the top five in brand recognition in the Midwest.
As for shopping visits to stores, Dicks Sporting Goods again took the top spot with 38 percent of respondents indicating that they had shopped at one of the chains stores in the last year. Foot Locker was second with 28 percent of respondents. REI and Bass Pro Shops moved up the ladder to the three and four spots, respectively, and Big 5 snagged the number five position. The Sports Authority had the sharpest fall in ranking of shopping visits versus the 2006 SGB Retail Report Card, ranking number nine for the 2008 survey, compared to third place in the report two years ago.
Outdoor-related retailers took the top four spots in the survey when consumers were asked to rank their overall experience at a retail store. The inclusion of Journeys in the top five was seen as unusual given the demographics of the study participants, although it may indicate a positive experience for parents of younger consumers. The high ranking for local independent retailers was also an interesting revelation. And it is interesting to point out that all but two of the top 10 retailers in the study are outdoor retailers or have a significant commitment to outdoor products. Granted, the REI consumer is much different from the Bass Pro shopper, but the rankings are a clear indication of just how much each satisfies the needs of their respective constituencies.
It was clearly a combination of price, product and service that drove consumers to vote the on the likelihood that they would continue to shop at a particular retailer. People that shopped at Academy Sports + Outdoors said they were more likely to continue to shop at Academy than any other consumers in the survey, indicating either an “extremely positive” (71 percent) or “somewhat positive” (20 percent) response when asked if they would continue to shop at the store. No other retailer had in excess of 90 percent of respondents suggest a positive likelihood that they would continue to shop at a particular store where they had shopped previously. REI came in second with an 88 percent positive likelihood, and Bass Pro Shops was third with 87 percent of shoppers signaling a positive likelihood to return. Local independent retailers and Joes Sports & Outdoors rounded out the top five, followed closely by Cabelas, The Finish Line, Sport Chalet and Big 5 Sporting Goods.
Price was a key contributor to the high standings of Academy, Big 5, Bass Pro and The Finish Line, where they were ranked numbers three, four and five, respectively. Sportsmans Warehouse took the number two spot on price. It should be noted that these ratings do not rank the retailers in the study as a comparison against each other, but rather as a positive or negative experience when shopping at each store. The broader “How America Shops” study does rate specific retailers and compares their ratings against other stores in which the same consumer also shopped. Higher customer service and product availability ratings were the other key contributors to the overall positive likelihood that a consumer would again shop at a particular store.
When looking at peer group analysis, Academy had the highest positive rating for full-line sporting goods retailers, with 88 percent of its customers indicating a positive overall view. Dicks Sporting Goods and Joes Sports & Outdoor were tied for second with an 87 percent positive rating, followed closely by Sport Chalet with an 86 percent positive rating from their customers surveyed in the study. The Sports Authority rounded out the top five with an 82 percent positive rating.
The price question in the full-line sector saw Academy take the top spot, followed by Big 5 and The Sports Authority. For customer service, Academy again rated atop the full-line group, but was tied with Sport Chalet. Dicks Sporting Goods, Olympia Sports and Joes Sports rounded out the top five.
Overall, regardless of trade channel, REI was ranked the highest for customer service, followed by Bass Pro Shops, local independents, Cabelas and Golfsmith. Not surprisingly, those rankings align pretty closely with the retailers ranked highest for a knowledgeable sales staff, quality of products and availability of product.
When asked about loyalty programs, 24 percent of the respondents said they belonged to such a program that offered discounts or other advantages for shopping at that store.
When asked if loyalty programs influenced where a consumer would shop for sporting goods, 17 percent said that such programs were “extremely important” and 23 percent said they were “somewhat important.”
A total of 46 percent of those surveyed said that loyalty programs were “not at all important” or “not very important.”
Approximately 27 percent of women respondents were members of a loyalty program, compared to just 19 percent of male respondents.
Of those consumers enrolled in a loyalty program, 62 percent said they had been able to take advantage of the program or had received awards from a loyalty program.
Less than 50 percent of loyalty program members said they shopped specifically at a certain retail store because they were a member of a loyalty program.
Of the respondents indicating that they were part of a sporting goods retailer loyalty program, 58 percent had purchased product at Dicks Sporting Goods, 38 percent had purchased at The Sports Authority, 30 percent had purchased at Foot Locker, and 26 percent had made purchases at REI.
The demographic group with household income over $100,000 represented the highest percentage of loyalty program members and the group with the highest percentage of those belonging to loyalty programs.
More than 35 percent of total respondents with household incomes over $100,000 belonged to a retailer loyalty program, while only 13 percent of those with household incomes under $40,000 belonged to such a program. The other groups had membership percentages that ranged from 21 to 23 percent of the total for each respective household income range.
Academy Sports + Outdoors had the highest average number of visits from consumers who said they shopped that retailers stores. Respondents that shopped at Academy in the last 12 months visited an Academy store an average of 4.8 times during that time.
Academy also converted a lot of consumers: respondents made an average of 3.8 purchases at Academy over the last 12 months.
Local independent stores (4.0x), Sportsmans Warehouse (3.8x), Dicks Sporting Goods (3.4x) and Joes Sports (3.3x) rounded out the top five in average number of visits to a store by respondents.
Respondents that shopped at Golfsmith visited an average of three times in the last year. Respondents that shopped at Golf Galaxy visited an average of 1.5 times.
Methodology of the Study
This research is designed to show the habits of the American population when purchasing sporting goods. Included in the research is a detailed description of where Americans shop for sporting goods, what they purchase at particular sporting goods retailers, and how the use of the Internet factors into their purchasing decisions. To qualify for this survey, each respondent must have purchased some type of sporting goods within the past year. A total of 1,400 completed interviews were conducted, with consumers highlighting their interaction with 35 different sporting goods retailers and 14 Internet retailers.
The survey was conducted in June 2008 among adults ages 18 to 65, and was administered over the Internet using a third-party Internet panel provider. SportsOneSource made every effort to control the demographics to best represent the U.S. population. However, with Internet surveys, the demographics tend to skew more toward older, Caucasian, and higher-income households. Within the survey, 44 percent of the respondents were male and 56 percent were female. The average age of the respondents was 44.1 years old.
A rating scale of 1 to 9 was used to measure certain attributes of respondents purchasing habits and patterns, with 1 being negative and 9 being positive. A response of “Dont Know” was removed from the rating and is not part of the overall average.
The results of the survey can be projected to the U.S. population with a margin of error of +/- 2.8 percentage points at the 95 percent confidence level.

