Fitbit Inc reported a profit on an adjusted basis of $36.3 million, or 14 cents a share, rebounding from a loss of $4.7 million, or 2 cents, a year ago. Sales inched up 0.1 percent to $571.2 million from $570.8 million. Device sales grew for the first time year-over-year since the fourth quarter of 2016.
Results were 7 cents better than analyst’s consensus estimate of 7 cents a share. Revenue also topped the consensus estimate of $568.16 million. First-quarter guidance, however, came in a bit below Wall Street’s targets.
Net earnings in the quarter came to $15.4 million, or 6 cents a share, against a loss of $45.5 million, or 19 cents, a year ago.
In the year, the loss on an adjusted basis was $48.8 million, or 20 cents a share, down from an adjusted loss of $61.1 million, or 26 cents, a year ago. The net loss came to $185.8 million, or 76 cents a share, against a loss of $277.2 million, or $1.19, a year ago. Revenues were down 6.4 percent to $1.51 billion from $1.62 billion.
“I’m proud of our performance this year – our results demonstrate that our strategy is the right one, placing us on a path back to growth and profitability. We grew our active users 9 percent to 27.6 million, became the #2 player in the smartwatch category in the U.S., and grew the number of devices sold in the fourth quarter,” said James Park, co-founder and CEO. “In 2019 we’re committed to offering more affordable devices with engaging health and fitness features, making the health benefits of being on Fitbit even more accessible. As a result, we are forecasting active users, devices sold, and revenue to grow in 2019. We expect our Fitbit Health Solutions revenue growth to accelerate to approximately $100 million and to grow non-device consumer revenue.”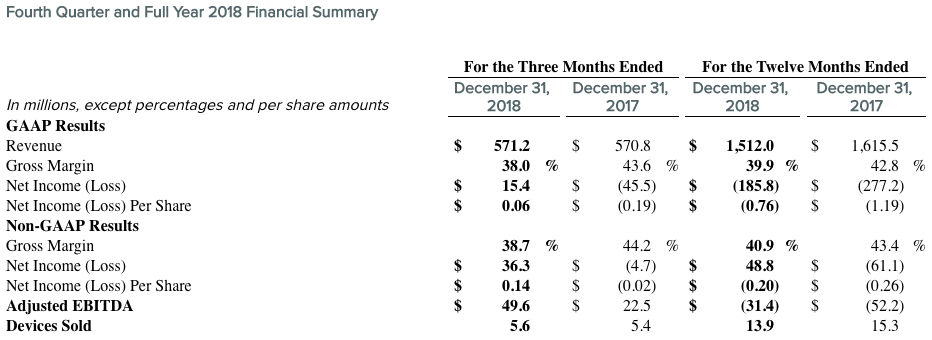
Fourth Quarter 2018 Financial Highlights
- Sold 5.6 million wearable devices, up 3 percent year-over-year. Average selling price decreased 2 percent year-over-year to $100 per device, driven by adding Fitbit Charge 3TM, its most intelligent tracker, to its device mix.
- APAC grew 26 percent to $49 million, U.S revenue decreased 1 percent to $328 million, EMEA revenue decreased 4 percent to $150 million, and Americas excluding U.S. revenue decreased 5 percent to $45 million, all year-over-year respectively.
- International revenue was $243 million, representing 43 percent of total revenue.
- New devices Fitbit VersaTM, Fitbit AceTM and Fitbit Charge 3 represented 79 percent of revenue.
- GAAP gross margin was 38.0 percent, and non-GAAP gross margin was 38.7 percent. Gross margin declined year-over- year driven by the mix shift towards smartwatches.
- GAAP operating expenses represented 36 percent of revenue, and non-GAAP operating expenses represented 32 percent of revenue.
Full Year 2018 Financial Highlights
- Sold 13.9 million wearable devices, down 9 percent year-over-year. Average selling price increased 4 percent year-over-year to $105 per device, driven by its device mix.
- 38 percent of all activations came from repeat customers; of repeat customers, 52 percent came from customers who were inactive during a prior period.
- APAC revenue grew 27 percent to $146 million. U.S. revenue decreased 7 percent to $881 million, EMEA revenue decreased 13 percent to $384 million, and Americas excluding U.S. revenue decreased 13 percent to $101 million, all on a year-over-year basis respectively.
- U.S. comprised 58 percent of revenue; EMEA 25 percent, APAC 10 percent, and Americas, excluding U.S. comprised 7 percent of revenue. International revenue was $631 million, or 42 percent of revenue, down 6 percent, year-over-year.
- Revenue from Fitbit.com was $155 million, representing 10 percent of revenue.
- New devices Fitbit Versa, Fitbit Ace and Fitbit Charge 3 represented 57 percent of revenue.
GAAP gross margin was 39.9 percent and non-GAAP gross margin was 40.9 percent. Non-GAAP gross margin declined 250 basis points year-over-year driven by the device mix shift towards smartwatches. - GAAP operating expenses declined 11 percent and non-GAAP operating expense declined 12 percent, each year-over-year, respectively.
- Cash, cash equivalents, and marketable securities totaled $723 million as of December 31, 2018, compared with $679 million as of December 31, 2017.
Full Year 2018 Operational Highlights
- Active users grew 9 percent to 27.6 million from 25.4 million as of December 31, 2017, driven by our continued innovation and investments in hardware and software, bringing new users to our community and engaging existing users.
- Smartwatch revenue grew to 44 percent of revenue, up from 8 percent in 2017. Became the #2 selling smartwatch company in the U.S.
- Headcount totaled 1,694 employees as of December 31, 2018, with 56 percent of employees in research and development.
The Fitbit Health Solutions business grew 8 percent in 2018. Fitbit extended its reach with employers, acquired Twine - Health (Fitbit Care), and expanded our relationship with payors and health systems. Fitbit became a key Medicare Advantage partner in 27 states with a top payer. Fitbit Care was chosen as the preferred coaching solution for Humana’s employer group segment.
First Quarter 2019 Guidance
- Fitbit expects an increase in devices sold and a decline in average selling price. Fitbit expects revenue to increase 1 percent to 8 percent year-over-year, in the range of $250 million to $268 million.
- Non-GAAP gross margin to be approximately 34 percent to 35 percent.
- Non-GAAP basic net loss per share in the range of ($0.24) to ($0.22).
- Capital expenditures as a percentage of revenue of approximately 3 percent.
- Adjusted EBITDA to be in the range of a loss of ($72) million to a loss of ($64) million.
- Effective non-GAAP tax rate of approximately 25 percent.
- Stock-based compensation expense of approximately $24 million and basic share count of approximately 254 million.
The non-GAAP loss between 22 to 24 cents a share compares with a consensus loss of 16 cents a share. The revenue guidance between $250 million to $268 million compares with Wall Street’s consensus target of $268 million.
Full Year 2019 Guidance
- Fitbit expects devices sold to increase in 2019, but average selling price to decline, driven by our intention to increase accessibility to our platform and grow our community of active users. Fitbit expects revenue to grow 1 percent to 4 percent year-over-year, in the range of $1.52 billion to $1.58 billion.
- Fitbit expects a lower warranty benefit and the mix shift towards smartwatches to put downward pressure on gross margin, partially offset by improved efficiencies. Fitbit expects non-GAAP gross margin to trend higher from the first quarter towards 40 percent for the full year, driven by improving device gross margin and a small benefit from the growth of non-device consumer revenue in the back half of the year.
- Fitbit expects to continue to drive operating leverage into the business and are targeting operating expenses in the range of $660 million to $690 million.
- Capital expenditures as a percentage of revenue of approximately 3 percent.
- Fitbit expects adjusted EBITDA to be in the range of ($30) million to breakeven.
With the year-over-year change in working capital less of a benefit in 2019 versus 2018, Fitbit expects free cash flow to be less than adjusted EBITDA in the range of approximately ($40) million to ($70) million. - Effective non-GAAP tax rate of approximately 30 percent. Fitbit expects effective non-GAAP tax rate to be volatile driven by geographic mix of revenue, tax credits, and our shift to profitability.
Stock-based compensation expense of approximately $90 million and basic/diluted share count of approximately 260/276 million.
Image courtesy Fitbit


