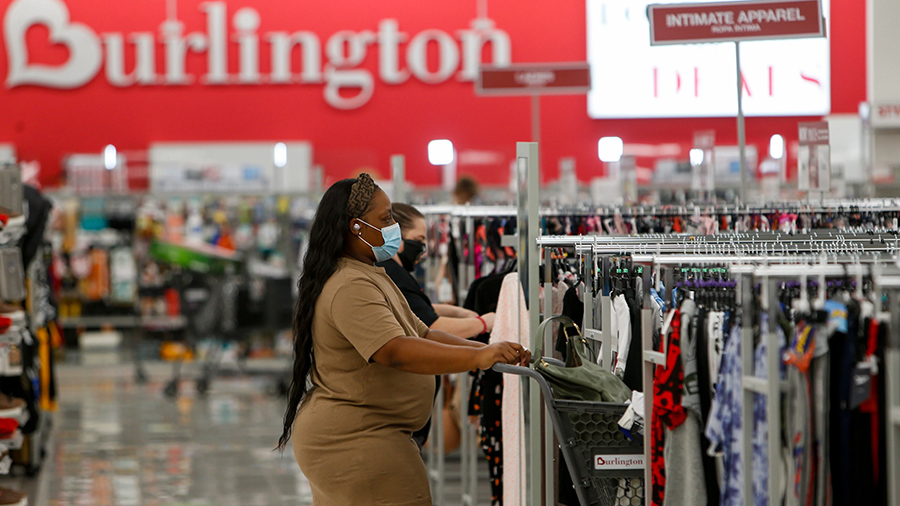
Burlington Stores, Inc. reported fiscal 2023 second quarter total sales increased 9 percent year-over-year to $2.17 billion, while comparable store sales increased 4 percent compared to the second quarter last year.
“Our comparable store sales growth for the second quarter was 4 percent, which was at the high end of our guidance range, while margin and earnings performance were significantly ahead of our guidance, stated CEO Michael O’Sullivan. “Our strategies to deliver great value to our customers are working, and we have been helped in the execution of these strategies by very strong availability of great off-price merchandise.”
O’Sullivan said in a release that while looking at the spring season as a whole, it is clear that the lower-income shopper, the retailer’s core customer, is still under significant economic pressure.
Gross margin rate as a percentage of net sales was 41.7 percent for the quarter, compared to 38.9 percent for the second quarter last year, an increase of 280 basis points. Merchandise margin improved by 150 basis points and freight expense improved 130 basis points.
Product sourcing costs, which are included in selling, general and administrative expenses (SG&A), were $183 million in Q2, compared to $157 million in the second quarter last year. Product sourcing costs include the costs of processing goods through our supply chain and buying costs.
SG&A was 35.7 percent as a percentage of net sales versus 34.6 percent in the second quarter last year, higher by 110 basis points. Adjusted SG&A was 27.0 percent as a percentage of net sales in Q2, compared to 26.1 percent in the second quarter last year, an increase of 90 basis points.
The effective tax rate was 26.4 percent in Q2, compared to 25.0 percent in the second quarter last year. The Adjusted Effective Tax Rate was 25.6 percent in Q2, compared to 25.1 percent in the second quarter last year.
Net income was $31 million, or 47 cents per share in Q2, compared to $12 million, or 18 cents per share for the second quarter last year. Adjusted Net Income was $39 million, or 60 cents per share, in Q2, compared to $23 million, or 35 cents per share for the second quarter last year. Adjusted Net Income included $1.8 million, or 3 cents per share, of expense related to recently acquired leases from Bed Bath & Beyond.
Adjusted EBITDA was $141 million in Q2, compared to $111 million in the second quarter last year, an increase of 90 basis points as a percentage of sales. Adjusted EBIT was $68 million in Q2, compared to $43 million in the second quarter last year, an increase of 100 basis points as a percentage of sales.
Merchandise inventories were $1.16 billion at quarter-end, compared to $1.27 billion at the end of the second quarter last year, an 8 percent decrease. Comparable store inventories increased 1 percent compared to the second quarter last year.
Reserve inventory was 45 percent of total inventory at the end of the second quarter of Fiscal 2023 compared to 52 percent at the end of the second quarter last year. Reserve inventory is largely composed of merchandise that is purchased opportunistically and that will be sent to stores in future months or next season.
The company ended the second quarter of Fiscal 2023 with $1.34 billion in liquidity, comprised of $521 million in unrestricted cash and $819 million in availability on its ABL facility.
The company ended the second quarter with $1.36 billion in outstanding total debt, including $942 million on its Term Loan facility, $397 million in Convertible Notes, and no borrowings on its ABL facility.
“Based on the underlying year-to-date comp trend we are narrowing our full-year comparable store sales guidance to a range of 3 percent to 4 percent versus 2022,” O’Sullivan announced. “It is possible that the trend will strengthen in the back half of the year, and if it does, then we are confident that we can chase it.”
Outlook
For the full Fiscal Year 2023 (the 53-weeks ending February 3, 2024), the company now expects:
- Total sales to increase approximately 11 percent to 12 percent, which includes approximately 2 percent from the 53rd week, on top of a 7 percent decrease in Fiscal 2022; this assumes comparable store sales will increase in the range of 3 percent to 4 percent, on top of the 13 percent decrease during Fiscal 2022;
- Capital expenditures, net of landlord allowances, to be approximately $560 million;
- To open 70-80 net new stores;
- Depreciation and amortization, exclusive of favorable lease costs, to be approximately $310 million;
- Adjusted EBIT margin to increase 60 to 80 basis points versus last year; this adjusted EBIT margin increase includes approximately $21 million of expected incremental expenses associated with the recently acquired Bed Bath & Beyond leases. Excluding these incremental expenses, adjusted EBIT margin is expected to increase 80 to 100 basis points versus last year;
- Net interest expense to be approximately $60 million;
- An effective tax rate of approximately 26 percent; and
- Adjusted EPS to be in the range of $5.37 to $5.67, which includes 23 cents of expected incremental expenses associated with the recently acquired Bed Bath & Beyond leases and an expected benefit from the 53rd week of approximately 5 cents. Excluding the incremental expenses, adjusted EPS is expected to be in the range of $5.60 to $5.90. This compares to Fiscal 2022 diluted EPS of $3.49 and Adjusted EPS of $4.26.
“Compared to our peers, we have a huge opportunity to expand our store count,” O’Sullivan suggested. “We also have potential to improve our sales productivity and individual store economics with our smaller store prototype. Over the past several months there has been an opening up in the supply of great real estate locations, driven by retail bankruptcies. We are very pleased that we have recently been able to acquire the leases to 62 former Bed Bath & Beyond stores. These locations together with the broader loosening of real estate supply should significantly strengthen our new store and relocation pipeline for 2024 and potentially beyond.”
For the third quarter of Fiscal 2023 (the 13 weeks ending October 28, 2023), the company expects:
- Total sales to increase in the range of 13 percent to 15 percent; this assumes comparable store sales will increase in the range of 5 percent to 7 percent versus the third quarter last year;
- Adjusted EBIT margin to increase 130 to 180 basis points versus the third quarter last year; this EBIT margin increase includes approximately $10 million of expected incremental expenses associated with the recently acquired Bed Bath & Beyond leases. Excluding these expenses, adjusted EBIT margin is expected to increase 170 to 220 basis points;
- An effective tax rate of approximately 26 percent; and
- Adjusted EPS in the range of 86 cents to $1.01, as compared to 26 cents in diluted EPS and 43 cents in Adjusted EPS in Q3 last year. This includes 11 cents per share of expected incremental expenses associated with the recently acquired Bed Bath & Beyond leases. Excluding these expenses, adjusted EPS is expected to be in the range of 97 cents to $1.12 a share.
Photo courtesy Burlington Stores


