Brunswick Corp. reported a profit against a loss in the fourth quarter although both periods included special charges. Sales 11.0 percent to $1.08 billion. Pacing the gains was the Fitness segment, which grew 24 percent, thanks to acquisitions.
2016 Full-Year Highlights:
- Consolidated net sales increased 9 percent versus 2015; on a constant currency basis, net sales increased 10 percent; excluding the impact of acquisitions, sales on a constant currency basis increased 5 percent.
- On a GAAP basis, operating earnings increased by 24 percent versus the prior year. Adjusted operating earnings were up 13 percent from 2015.
- On a GAAP basis, 2016 diluted EPS of $2.98 increased by 24 percent versus 2015. Diluted EPS, as adjusted, of $3.48 increased by 19 percent.
- Net cash from operations was $426 million and free cash flow was $234 million; both were improved versus the prior year.
“Our results in 2016 represent the seventh consecutive year of strong improvements in operating performance,” said Brunswick chairman and chief executive officer Mark Schwabero. “These outstanding results reflect the continued execution of our business strategy by our global workforce.
“Our top line reflected the benefits of our acquisition strategy, particularly in our Fitness segment, and strong growth rates in both fiberglass outboard boats and marine parts and accessories. This growth also included solid performance in aluminum boats, outboard engines and fiberglass sterndrive/inboard boats.
“The U.S. marine market exhibited solid fundamentals and growth, which are supported by stable boating participation, favorable replacement cycle dynamics and innovative products being introduced throughout the marketplace. Overall, international marine markets were challenging, including weak demand in certain markets such as Latin America, the Middle East and Africa as well as Canada. Our product successes in both our Engine and Boat segments have enabled continued market share gains and mix benefits.
“In addition, our fitness business benefited from solid demand, particularly in overall global commercial fitness markets. This foundational core growth, combined with favorable trends in the rehabilitation and active aging categories, as well as increased participation in group exercise activities, is providing a dynamic marketplace in which to execute our fitness growth strategy. We continue to make outstanding progress integrating the Cybex business into our Fitness segment and slightly exceeded our 2016 earnings objective for this acquisition. We remain well positioned to meet the long-term earnings objectives for this acquisition,” Schwabero said.
“Consolidated adjusted operating earnings in 2016 increased by 13 percent as compared to the prior year, including the impact of planned investments in growth initiatives. The improvement in operating earnings, combined with a lower effective tax rate, as adjusted, and fewer shares outstanding, led to a 19 percent increase in diluted earnings per common share, as adjusted,” Schwabero concluded.
Discontinued Operations
On May 22, 2015, the company completed the sale of its Bowling Products business. The results of this business are reported as discontinued operations. For all periods presented in this release, all figures and outlook statements incorporate this change and reflect continuing operations only, unless otherwise noted.
2016 Full-Year Results
For the year ended Dec. 31, 2016, the company reported net sales of $4,488.5 million, up from $4,105.7 million in 2015. For the year, operating earnings were $409.0 million, which included a $55.1 million pension settlement charge and $15.6 million of restructuring, integration and impairment charges. In 2015, the company reported operating earnings of $331.7 million, which included an $82.3 million pension settlement charge and $12.4 million of restructuring and impairment charges.
For 2016, the company reported net earnings of $274.4 million, or $2.98 per diluted share, compared with net earnings of $227.4 million, or $2.41 per diluted share, for 2015. The diluted EPS for 2016 included a $0.38 per diluted share pension settlement charge; an $0.11 per diluted share of restructuring, integration and impairment charges and a $0.01 per diluted share expense from special tax items. Diluted EPS for 2015 included a $0.54 per diluted share pension settlement charge; an $0.11 per diluted share of restructuring and impairment charges and a $0.13 per diluted share benefit from special tax items.
Fourth Quarter Highlights:
- Consolidated net sales increased 10 percent versus fourth quarter 2015; on a constant currency basis, net sales also increased 10 percent; excluding the impact of acquisitions, sales on a constant currency basis increased 4 percent.
- On a GAAP basis, operating earnings increased $55.6 million from fourth quarter 2015. Adjusted operating earnings increased to $90.5 million, or 34 percent versus 2015.
- On a GAAP basis, diluted EPS of 19 cents a share, an increase of 29 cents a share versus the fourth quarter of 2015. Diluted EPS, as adjusted, of $0.67 represented a 29 percent increase compared to the prior year.
Fourth Quarter Results
For the fourth quarter of 2016, the company reported net sales of $1,083.0 million, up from $986.1 million a year earlier. For the quarter, the company reported operating earnings of $28.6 million, which included a $55.1 million pension settlement charge and $6.8 million of restructuring, integration and impairment charges. In the fourth quarter of 2015, the company had an operating loss of $27.0 million, which included an $82.3 million pension settlement charge and $12.4 million of restructuring and impairment charges.
For the fourth quarter of 2016, Brunswick reported net earnings of $17.8 million, or 19 cents a share , compared with a net loss of $9.0 million, or 10 cents per diluted share, for the fourth quarter of 2015. The diluted EPS for the fourth quarter of 2016 included 38 cents per diluted share of pension settlement charges, 5 cents per diluted share of restructuring, integration and impairment charges, along with 5 cents per diluted share expense from special tax items. The diluted EPS for the fourth quarter of 2015 included 55 cents per diluted share of pension settlement charges, an 11 cents per diluted share of restructuring and impairment charges and a 4 cents per diluted share benefit from special tax items.
Review of Cash Flow and Balance Sheet
Cash and marketable securities totaled $458.2 million at the end of 2016, down $210.6 million from year-end 2015 levels. Net cash provided by operating activities of $425.7 million, increased $87.4 million versus the prior year, which was the result of higher net earnings and reduced working capital usage.
Investing and financing activities for the year included $276.1 million for acquisitions, $193.9 million for capital expenditures, $120.3 million for common stock repurchases and $55.4 million for dividends.
Marine Engine Segment
The Marine Engine segment, consisting of the Mercury Marine Group, including the marine parts and accessories businesses, reported net sales of $500.2 million in the fourth quarter of 2016, up 5 percent from $474.7 million in the fourth quarter of 2015. International sales, which represented 37 percent of total segment sales in the quarter, were up 4 percent compared to the prior year period. On a constant currency basis, international sales were up 3 percent. For the quarter, the Marine Engine segment reported operating earnings of $51.2 million. This compares with operating earnings of $41.9 million in the fourth quarter of 2015.
Sales increases in the quarter primarily reflected strong growth in the segment’s parts and accessories businesses, which included revenues from acquisitions completed in the fourth quarters of 2015 and 2016 along with slight gains in the sterndrive and outboard engine businesses. Higher revenues and cost reductions, including benefits from lower commodity costs and savings related to sourcing initiatives, contributed to the increase in operating earnings in the fourth quarter of 2016. Partially offsetting these positive factors were the unfavorable effects of foreign exchange.
Boat Segment
The Boat segment is comprised of the Brunswick Boat Group and includes 15 boat brands. The Boat segment reported net sales of $358.0 million in the fourth quarter of 2016, an increase of 7 percent compared with $336.0 million in the fourth quarter of 2015. International sales, which represented 25 percent of total segment sales in the quarter, decreased by 2 percent during the period. On a constant currency basis, international sales were down 3 percent. For the fourth quarter of 2016, the Boat segment reported operating earnings of $14.9 million, including restructuring charges of $0.6 million. This compares with operating earnings of $2.6 million in the fourth quarter of 2015, including restructuring and impairment charges of $7.7 million.
The segment’s increase in revenue reflected strong growth in fiberglass outboard and sterndrive/inboard boats as well as increases in aluminum boats. Operating earnings benefited from higher sales, which included continued market share gains and a favorable change in product mix.
Fitness Segment
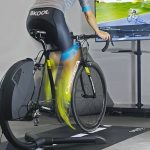
The Fitness segment designs, manufactures and sells strength and cardiovascular fitness equipment and active recreation products. Fitness segment sales in the fourth quarter of 2016 totaled $294.7 million, up 24 percent from $237.7 million in the fourth quarter of 2015. International sales, which represented 42 percent of total segment sales in the quarter, increased by 21 percent. Excluding the impact of acquisitions, Fitness segment sales in the quarter, on a constant currency basis, increased by 4 percent compared to the prior year. On a constant currency basis, excluding the impact of acquisitions, international sales increased by 6 percent. For the quarter, the Fitness segment reported operating earnings of $44.0 million, including $3.9 million of restructuring and integration charges. This compares with operating earnings of $39.9 million in the fourth quarter of 2015.
The increase in revenue reflected the benefit of acquisitions as well as growth in global commercial fitness revenues, particularly in international markets. The increase in operating earnings included contributions from the Cybex acquisition and higher sales, partially offset by net unfavorable changes in sales mix.
2017 Outlook
“Our outlook for 2017 is generally consistent with our three-year strategic plan and reflects another year of outstanding earnings growth, with excellent cash flow generation,” said Schwabero. “Our recent results reflect the continued success of our strategy and we believe we are well-positioned to generate sales and earnings growth consistent with our three-year plan.
“We expect our marine businesses’ top-line performance will benefit from the continuation of solid growth in the U.S. and Europe and improving market conditions in certain international markets, along with the success of new products. The Fitness segment is expected to benefit from growth in global commercial fitness markets, as well as contributions from new products, particularly in the second half of 2017. As a result, our plan reflects overall revenue growth rates in 2017 in the range of 6 percent to 8 percent, absent any significant changes in global macro-economic conditions. Completed acquisitions, are included in this guidance and in total, are expected to account for about 1 percent of 2017’s projected growth.
“For the full-year, we anticipate improvement in both gross margins and operating margins, as we plan to continue to benefit from volume leverage, cost reductions related to efficiency initiatives and modest positive product mix factors. Operating expenses are estimated to increase in 2017 as we continue to fund incremental investments to support growth; however, on a percentage of sales basis, are expected to be at slightly lower levels than 2016. Our guidance for 2017 reflects a diluted EPS, as adjusted, range of $3.90 to $4.05. Finally, for the full-year 2017, we expect to generate free cash flow in excess of $250 million,” Schwabero concluded.


