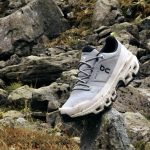
Amer Sports saw net sales increase 9.1 percent to €489.8 million ($642 mm) in the first quarter, or 7 percent in currency neutral (c-n) terms. The biggest growth took place in Apparel, up by 29 percent, and Footwear, up by 13 percent. Sales in the Wilson's Individual Ball Sports business increased 8 percent.
Winter and Outdoor's net sales were up 8 percent in local currencies despite a 9 percent decline in Winter Sports Equipment. The Americas led growth with 18 percent sales growth.
| EUR million | 1-3/2012 | 1-3/2011 | Ch % | Ch %*) | 2011 |
| Net sales | 489.8 | 449.1 | 9 | 7 | 1,880.8 |
| Gross profit | 216.3 | 194.6 | 11 | 9 | 817.4 |
| Gross profit % | 44.2 | 43.3 | 43.5 | ||
| EBIT | 29.0 | 25.7 | 13 | 9 | 135.5 |
| EBIT % | 5.9 | 5.7 | 7.2 | ||
| Financing income and expenses | -5.0 | -4.3 | -20.5 | ||
| Earnings before taxes | 24.0 | 21.4 | 115.0 | ||
| Net result | 18.7 | 17.1 | 90.9 | ||
| Earnings per share, EUR | 0.15 | 0.13 | 0.71 | ||
| Net cash flow after investing activities | 97.4 | 87.1 | -21.4 | ||
| Equity ratio, % at period end | 40.8 | 47.4 | 45.6 | ||
| Gearing, % at period end | 57 | 35 | 47 | ||
| Personnel at period end | 7,158 | 6,804 | 5 | 7,061 | |
| Average rates used, EUR/USD | 1.31 | 1.37 | 1.39 |
OUTLOOK FOR 2012
Amer Sports expects broad-based sales growth and profitability improvement across most business areas in 2012, with the exception of Winter Sports Equipment where pre-orders are expected to decline and profitability to be adversely impacted by the late and mild winter in season 2011/12, especially in North America and Southern Europe.
However, the Winter Sports Equipment operational efficiency program which started in 2010 is proceeding ahead of plan and will partially help to mitigate the negative impacts of the expected pre-order decline.
Amer Sports' net sales in local currencies are expected to increase from 2011 in line with the company's annual 5 percent growth target. Leveraging Amer Sports' brands into apparel, footwear and accessories continues to be the main growth driver for the company.
Net sales by business segment
EUR million | 1-3/ 2012 | 1-3/ 2011 | Change % | Change %*) | % of sales 2012 | 2011 |
| Winter and Outdoor | 256.5 | 233.5 | 10 | 8 | 52 | 1,137.6 |
| Ball Sports | 173.6 | 159.0 | 9 | 6 | 36 | 511.0 |
| Fitness | 59.7 | 56.6 | 5 | 1 | 12 | 232.2 |
| Total | 489.8 | 449.1 | 9 | 7 | 100 | 1,880.8 |
*) Change in local currencies
Geographic breakdown of net sales
| EUR million | 1-3/ 2012 | 1-3/ 2011 | Change % | Change %*) | % of sales 2012 | 2011 |
| EMEA | 226.7 | 214.1 | 6 | 4 | 46 | 917.6 |
| Americas | 205.7 | 186.4 | 10 | 7 | 42 | 742.1 |
| Asia Pacific | 57.4 | 48.6 | 18 | 16 | 12 | 221.1 |
| Total | 489.8 | 449.1 | 9 | 7 | 100 | 1,880.8 |
*) Change in local currencies
Overall gross margin was 44.2 percent of sales versus 43.3 percent in Q1 2011 with a broad-based improvement.
Group EBIT was up 12.8 percent to €29.0 million ($38 mm). Increased sales volumes contributed approximately €12.7 million to EBIT growth, higher gross margins approximately €4.4 offset by increased operating expenses, net of other income and expenses, of approximately €-11.7 million.
Group EBIT was up 12.8 percent to €29.0 million ($38 mm). Increased sales volumes contributed approximately €12.7 million to EBIT growth, higher gross margins approximately €4.4 offset by increased operating expenses, net of other income and expenses, of approximately €-11.7 million.
Operating expenses increased due to volume growth related sales and distribution costs and marketing, including continuous investments in own retail. Also, the company is d


