Billabong International Ltd. said its three core brands – Billabong, Element and RVCA – all delivered growth in its fiscal year ended June 30, but operating earnings were down due to foreign currency headwinds and gross margin pressures to reduce inventories.
All figures quoted are in Australian dollars (AUD) unless otherwise stated.
Highlights:
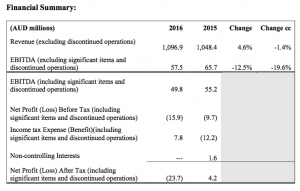
- Total Group sales were $1.1 billion, up 4.6 percent on the prior corresponding period (pcp) and down 1.4 percent on a constant currency (cc) basis.
- The Group’s big three brands continued to grow in global wholesale equivalent revenue (including sales to own retail) – up in total by 5.3 percent for the year. Billabong was up 1.9 percent, Element 5.3 percent and RVCA 18.1 percent on a cc basis.
- Comparable total retail revenues (including comparable brick-and-mortar and e-commerce) were up 1.8 percent (cc) for the year, including an increase of 52 percent in global e-commerce sales.
- Significant progress was made in reducing excess inventory in the Americas, down $20 million in the last six months and now largely back in line with the prior period.
- Earnings before interest tax depreciation and amortisation (EBITDA) grew in Europe for the third consecutive year, APAC overcame most of a $12 million increase in product cost as a result of a lower AUD, and the Americas performed better in the second half compared to the first half.
- Including significant items, net loss after tax for the full year to June 30, 2016 was $23.7 million.
- EBITDA, excluding significant items and discontinued operations, was $57.5 million, compared to $65.7 million in the pcp.
Neil Fiske, chief executive of Billabong, commented:
“The Group has made significant progress in the last year. The big three brands – Billabong, Element and RVCA – all grew and gained share in key markets, we improved the cost base and simplified the business further and comparable retail revenue increased with e-commerce sales up 52 percent. We also improved our position in the crucial specialty wholesale channel, which is a leading indicator of brand strength with the core consumer.”
Against a backdrop of global uncertainty and industry change, we continue to focus on the levers within our control, including inventories, initiatives to lift margins, cost of doing business (CODB) and quality distribution. Inventories are back in line, we’ve become more efficient and we are building the global platforms that will help our brands grow and expand operating margins over time. Our strategy is to create strong global brands with tight distribution and an omni platform that integrates wholesale, retail stores, e-commerce and social media. That’s the way our consumer wants to shop. In an industry in transition, we believe our strategy is right and positions us well.”
Brand-led growth strategy
The Group’s strategy has led the big three brands of Billabong, Element and RVCA to deliver an increase in total sales, including to own retail, of 5.3 percent on a constant currency basis in 2016.
Underpinning this approach has been an investment in global brand structures and platforms, marketing and design, and new advocates and athletes which have delivered a significant lift in consumer engagement. The rapid growth in social media followers demonstrates the big three brands have tremendous customer loyalty. The Omni platform will put customers, and the way they want to shop, at the heart of the business and in turn drive revenue improvement.
The big three brands combined, including advocates and athletes, have more than 26 million followers on social media. In the last year, brand Billabong increased followers across all major social media platforms by 16 percent. Including advocates and athletes, it now has a social media following in excess of 12.2 million. RVCA’s following is up 22 percent and Element’s is up 31 percent in the last year.
In the core surf specialty channel, brand Billabong continues to widen its lead in both the United States and Australia, as independently evaluated by Action Watch.
In 2016 Billabong has one of its largest ever teams on the World Surf League (WSL) Tour with Courtney Conlogue currently ranked number two in the world, and Jack Freestone and Ryan Callinan joining the men’s circuit. Emerging talent includes Women’s World Junior Champion Isabella Nichols and current number two on the WSL Qualifying Series, Ethan Ewing, along with a range of promising juniors coming through the Bloodlines program.
Element lifted sales globally by 5.3 percent. The brand this month launched a store adjacent to one of the best new skate parks in America in Boise, ID and athletes such as seven-time X Games gold medalist Nyjah Huston continue to drive Element’s profile. With skate joining surfing in the 2020 Tokyo Olympics, the brand’s appeal is set to spread to an even wider global audience.
RVCA is beginning to show its global potential. In the Americas sales growth remained robust, whilst in Asia Pacific sales (including to owned retail) grew 40 percent (cc), up by $5.2 million, with strong growth in both wholesale and retail. In Australia, the brand is now firmly established, including a pleasing performance from its recently opened Byron Bay store. In Europe sales growth was 25 percent. RVCA is performing strongly in the Group’s own stores in every region.
Net loss after tax, including significant items and discontinued businesses, was $23.7 million compared to a profit of $4.2 million for the pcp. More than two-thirds of the decline related to higher tax expense. Tax expense of $7.8 million this year, compared to a $12.2 million tax credit in the pcp, represents a change of $20 million year on year. This is not representative of the Group’s income tax payments, which increased less than $1 million to $3.1 million for the year.
EBITDA, excluding significant items and discontinued operations, a key indicator of operating performance, was $57.5 million, down from $65.7 million in the pcp.
For the second six months of the year EBITDA, excluding significant items and discontinued operations, was $20.3 million, down from $22.9 million in the pcp.
Comparable gross margins declined 2 percent reflecting, in Asia Pacific and Europe, the increased cost of goods compared to the pcp from the relative higher U.S. dollar and, in the Americas, the requirement for higher markdowns to reduce excess inventory. Importantly, the second half showed improvements in the decline in comparable gross margin, abating from 260 bps in the first half to 160 bps in the second half. It is anticipated that margins will improve over the course of the next financial year.
In the Americas, excess inventory has reduced by $20 million during the last six months, and is now largely back in line with pcp.
The Group achieved a material reduction in CODB of $19 million (cc) or 110 basis points for the year.
The Company completed and announced the sale of Sector 9 in June 2016. Because of its size, Sector 9 did not satisfy the conditions of AASB 5 to be disclosed as a discontinued operation. Accordingly, Sector 9 results up to the time of sale are included in the Group’s continuing operations. Sector 9 contributed negative EBITDA of $1.1 million in the year to 30 June 2016, compared to positive EBITDA of $3.4 million (cc) in the pcp.
Americas
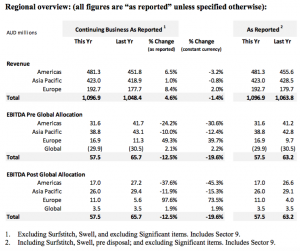
In the Americas, EBITDA before global allocations was $31.6 million for the year, a decline of $10.1 million on the pcp, or $13.9 million on a constant currency basis. The majority of this decline occurred in the first half of the year. The result includes a $4.4 million reduction in EBITDA from Sector 9, which was sold in June 2016.
Comparable gross margins declined 2 percent for the year due to the effect of clearing excess inventory bought in the first half of the year. At the end of December 2015 Americas inventory levels were $25 million higher than the prior year, whereas by the end of the year comparable inventory was just $2 million higher than June 2015 (cc).
Total comparable direct-to-consumer revenues (comparable brick-and-mortar plus e-commerce) increased slightly, with e-commerce growing 24.9 percent (cc) while comparable-store sales fell 6 percent (cc) for the year.
Total external wholesale revenues fell 2.7 percent for the year, weighed down by Sector 9, although this also includes an increase in low-margin sales as excess inventory was cleared.
Asia Pacific
EBITDA for the Asia Pacific region was $38.8 million before global allocations, compared to $43.1 million for the pcp, as the region absorbed $12 million of increased cost of goods resulting from a relatively stronger U.S. dollar compared to the pcp.
Overall sales for the region were down 0.8 percent (cc) for the year, with comparable store sales in Australia up 2.6 percent for the year for mono-brand stores and down 1.3 percent for multi-brand.
E-commerce sales were up 154 percent, off a small base but highlighting the opportunity of the omni platform.
Comparable gross margins were down 1.6 percent for the year as a direct result of the currency-related cost increases, although the decline in the second half was just 0.8 percent, as the benefits of the Group’s sourcing and merchandising strategies overcame more of the currency impacts.
During the financial year, 15 new retail stores were opened, mainly mono-brand, and the company is pleased with the results of the new stores.
Europe
Europe improved its EBITDA result for the third successive year.
European EBITDA of $16.9 million before global allocations was up from $11.3 million in the pcp.
Total revenue in the region grew 2 percent (cc) and, despite increased cost of goods from currency-related cost increases, sourcing benefits and other cost controls allowed EBITDA margin for the region to expand by 2.6 percent (after global allocation).
Comparable-store sales were up 2.7 percent (cc), with e-commerce sales up 160 percent (cc), again from a low base.
Balance Sheet
As noted in previous results, the Group’s senior term debt is denominated in U.S. dollars. At balance date, when converted into Australian dollars, total borrowings were $274.4 million compared to $266.9 million at June 30, 2015. Net debt was $185.2 million at June 30, 2016, compared to $113.5 million a year earlier. The increase in net debt includes the $19 million final instalment for the 2010 acquisition of RVCA, and a $9 million increase in the AUD equivalent of the term loan from exchange rate movements.
As announced in July 2016, Billabong refinanced its asset-backed lending facility (ABL) by entering into a new facility agreement for US$100 million with Bank of America Merrill Lynch (BAML). The BAML ABL facility replaces the GE Capital facility that was entered into in December 2013 and provides Billabong with improved terms and flexibility. The BAML ABL has a five-year term (subject to terms and conditions), market competitive rates and will include assets in both Europe and New Zealand for the first time.
Dividend
No dividend has been declared.
Outlook
For the month of July 2016, EBITDA was ahead of the prior year; however, July is a seasonally small month for the Group. The Group’s results for the 2017 financial year will again be significantly influenced by the strength of the key November/December retail trading in Asia Pacific and the implications of the consolidation and rationalisation occurring in the North American retail market.
The Company continues to be confident of its ability to manage those elements of the strategy that are within its control, including brand performance, margin improvements, inventory and CODB, and expects the benefits of the project agenda to contribute to the 2017 financial year’s result.


