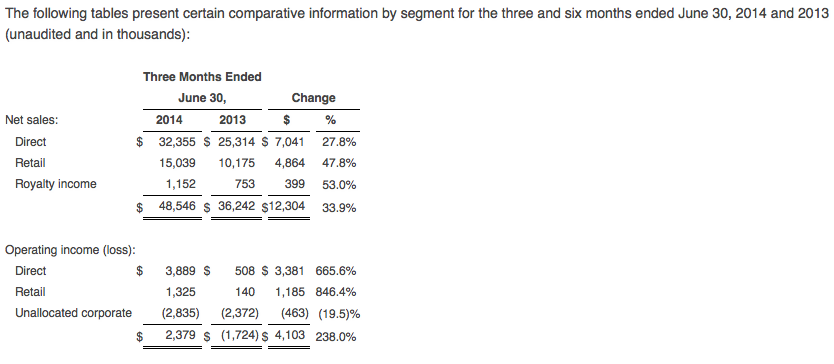
Nautilus, Inc. reported net sales for the second quarter of 2014 totaled $48.5 million, a 34 percent increase compared to $36.2 million in the same quarter of 2013. The strong growth was driven by higher sales in both the Direct and Retail segments.
For the first six months of 2014, net sales were $120.5 million, an increase of 26 percent over the same period last year. Gross margins for the second quarter improved by 320 basis points to 51.0 percent, reflecting margin increases in both the Direct and Retail segments. Operating income from continuing operations for the second quarter of 2014 was $2.4 million, compared to an operating loss from continuing operations of $1.7 million reported in the same quarter of 2013. The increase in operating income reflects higher sales and gross margins in both the Direct and Retail segments combined with improved leverage of sales and marketing and general and administrative costs across higher sales volumes. For the first six months of 2014, operating income from continuing operations was $11.4 million, compared to $4.3 million in the same prior period, an increase of 167 percent.
Pretax income from continuing operations for the second quarter of 2014 was $2.3 million, or $0.07 per diluted share compared to a pretax loss from continuing operations of $1.6 million, or a $0.05 loss per diluted share for the second quarter of last year. For the first six months of 2014, pretax income from continuing operations was $11.3 million, or $0.36 per diluted share, compared to $4.3 million, or $0.14 per diluted share, compared to the prior year six month period.
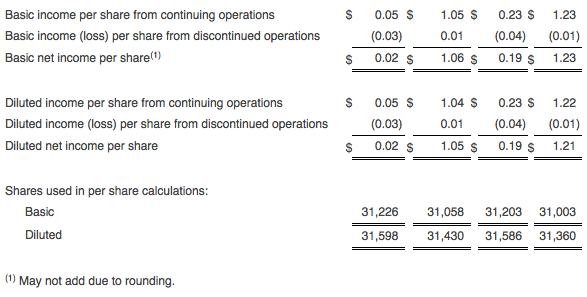
Net income from continuing operations for the second quarter of 2014 was $1.5 million, or $0.05 per diluted share. Net income from continuing operations for the second quarter of 2013 was $32.7 million, or $1.04 per diluted share, which included a net income tax benefit of $34.3 million, or $1.09 per diluted share, due primarily to a partial reversal in the second quarter of 2013 of a valuation allowance recorded against the company’s deferred tax assets.
As previously stated, beginning in the first quarter of 2014, the company started to record income taxes at a normalized rate following the partial release, in 2013, of its valuation allowance recorded against its deferred tax assets. The effective income tax rate for continuing operations in the second quarter of 2014 was 35.8 percent. The effective tax rate for the remainder of the year is expected to be between 35 percent and 40 percent. Cash payments related to income taxes were minimal due to the company’s significant domestic net operating loss carry forwards.
For the second quarter of 2014, the company reported net income (including discontinued operations) of $0.6 million, or $0.02 per diluted share; this includes a loss from discontinued operations of $0.9 million. In the second quarter of 2013, the company reported net income of $32.9 million, or $1.05 per diluted share, including $0.2 million income from discontinued operations and the aforementioned income tax benefit of $1.09 per diluted share.
Bruce M. Cazenave, Chief Executive Officer, stated, “Our second quarter results reflect solid performances across the business, with double digit top line growth in our Direct and Retail segments along with continued gross margin improvements in all segments. In the Direct business, our sales benefitted from incremental sales of the new Bowflex MAX Trainer product line. We continue to be encouraged by MAX Trainer’s early contribution and the long-term potential for the product. We are pleased with the strong operating income performance from our Direct business of $3.9 million in our seasonally slowest quarter.”
Cazenave continued, “Our Retail business also performed well in the second quarter, as we continue to receive positive feedback regarding our lineup of new cardio products launched last year including our elliptical and stationary bikes. This gives us encouragement as we prepare to introduce additional Retail products over the next several months. As we begin the back half of 2014, our team remains committed to execution on our key areas of focus of product innovation, margin improvement and achieving operating leverage.”
For further information, see “Results of Operations Information” attached hereto.
Segment Results
Net sales for the Direct segment were $32.4 million in the second quarter of 2014, an increase of 28 percent over the comparable period last year. Direct segment sales benefited from the strong performance of the new Bowflex MAX Trainer product line, partially offset by a decline in Direct sales of strength products, which continue to migrate to the Retail business. For the first six months of 2014, net sales for the Direct segment were $83.1 million, an increase of 22 percent over the same period last year. U.S. credit approval rates rose to 38.8 percent in the second quarter of 2014, up from 33.8 percent for the same period last year. The company attributes the increase in U.S. credit approval rates to its media strategy focused on driving quality customer leads and an expanded consumer financing lender base.
Operating income for the Direct segment was $3.9 million for the second quarter 2014, compared to $0.5 million in the second quarter 2013. Operating income benefitted from higher gross margins and improved leverage of selling and marketing expenses as a percentage of sales in the second quarter of 2014. Gross margin for the Direct business was 61.7 percent for the second quarter of 2014, compared to 57.6 percent in the second quarter of last year, benefitting from improved overall overhead operating efficiency and favorable product mix.
Net sales for the Retail segment were $15.0 million in the second quarter 2014, an increase of 48 percent over the second quarter last year. The improvement in Retail net sales reflects strong retailer and consumer acceptance of the company’s new lineup of cardio products launched last fall. For the first six months of 2014, net sales for the Retail segment totaled $35.1 million, an increase of 39 percent over the same period last year.
Operating income for the Retail segment was $1.3 million for the second quarter 2014, compared to $0.1 million in the second quarter last year. Retail gross margin was 24.4 percent in the second quarter of 2014, compared to 19.5 percent in the same quarter of last year.
Royalty revenue in the second quarter 2014 was $1.2 million, an increase of 53 percent compared to $0.8 million for the same quarter of last year, primarily reflecting higher revenue from licensed patents.
Balance Sheet
As of June 30, 2014, the company had cash, cash equivalents, and marketable securities of $57.3 million and no debt, compared to cash, cash equivalents, and marketable securities of $41.0 million and no debt at year end 2013. Working capital of $58.6 million as of June 30, 2014 was $12.9 million higher than the 2013 year-end balance of $45.7 million, primarily due to growth in cash equivalents and marketable securities of $16.3 million during the first half of the year. Inventory as of June 30, 2014 was $23.2 million, compared to $15.8 million as of December 31, 2013 and $13.3 million at the end of the second quarter last year. The increase in inventory reflected several factors including pre-buying to allow for production disruption related to a planned factory expansion by a supplier, the potential for work stoppage at certain West Coast ports, and alignment of inventory for the new distribution center which is expected to open shortly in Ohio.
Non-GAAP Presentation
In addition to disclosing results determined in accordance with GAAP, Nautilus discloses certain non-GAAP operating results that exclude certain charges. In this news release, the company has presented pretax income per diluted share from continuing operations which is a non-GAAP financial measure.
When presenting non-GAAP information, the company includes a reconciliation of the non-GAAP results to the most directly comparable financial measure calculated and presented in accordance with GAAP. The company presents pretax income per diluted share from continuing operations because management believes that the partial reversal of valuation allowances in fiscal year 2013, resulting in significant changes to the effective tax rate, makes meaningful comparisons between periods difficult. Including the non-GAAP results assists investors in assessing the company's operational performance relative to its competitors and its historical financial performance. The company presents these non-GAAP results as a complement to results provided in accordance with GAAP, and these results should not be regarded as a substitute for GAAP. The company strongly encourages you to review all of its financial statements and publicly-filed reports in their entirety and to not rely on any single financial measure.


