
Macy’s, Inc. reported that net sales decreased 4.3 percent to $7.8 billion for the quarter ended February 1. Comparable store sales were down 1.1 percent on an owned basis and up 0.2 percent on an owned-plus-licensed-plus-marketplace basis.
Comparable owned-plus-licensed-plus-marketplace sales growth at Macy’s First 50 locations, Macy’s digital channel, Bloomingdale’s, and Bluemercury was offset primarily by weakness in Macy’s non-First 50 and non-go-forward locations.
Macy’s, Inc. go-forward business comparable sales were down 0.7 percent on an owned basis and up 0.6 percent on an owned-plus-licensed-plus-marketplace basis.
- Macy’s banner net sales were down 5.3 percent, with comparable sales down 1.9 percent on an owned basis and down 0.9 percent on an owned-plus-licensed-plus-marketplace basis.
- Macy’s go-forward business comparable sales were down 1.6 percent on an owned basis and down 0.5 percent on an owned-plus-licensed-plus-marketplace basis.
- Macy’s First 50 locations comparable sales were up 0.8 percent on an owned basis and up 1.2 percent on an owned-plus-licensed basis.
- Bloomingdale’s net sales were up 2.0 percent, with comparable sales up 4.8 percent on an owned basis and up 6.5 percent on an owned-plus-licensed-plus-marketplace basis.
- Bluemercury net sales were up 2.4 percent and comparable sales were up 6.2 percent on an owned basis.
- Other revenue of $239 million decreased $16 million, or 6.3 percent. Within Other revenue:
- Credit card revenues, net decreased $20 million, or 10.3 percent, to $175 million, primarily due to lower year-over-year profit share, inclusive of higher net credit losses.
- Macy’s Media Network revenue, net rose $4 million, or 6.7 percent, to $64 million, reflecting continued growth in number of advertisers and campaign counts.
Income Statement Summary
Gross margin decreased 80 basis points year-over-year (y/y) to 35.7 percent of net sales. The change relative to the prior-year Q4 gross margin rate was impacted by Macy’s nameplate’s conversion to cost accounting. Separate from cost accounting, merchandise margin benefited from favorable year-over-year shortage trends which were offset by product mix.
Selling, general and administrative (SG&A) expense of $2.4 billion decreased $23 million y/y. The decrease in SG&A expense reportedly reflects a disciplined approach to non-customer facing costs while focusing on investments that will drive future sales. As a percent of total revenue, SG&A expense increased 100 basis points to 29.7 percent, reportedly due to lower total revenue.
Asset sale gains of $41 million were flat. Fourth quarter 2024 asset sale gains were said to primarily relate to the monetization of non-go-forward locations associated with the company’s Bold New Chapter strategy.
GAAP diluted earnings per share (EPS) was $1.21 and Adjusted diluted EPS was $1.80 per share, compared to GAAP diluted loss per share of 47 cents and Adjusted diluted EPS of $2.24, in the fourth quarter of 2023.
Fiscal Year 2024 Results
(Comparisons versus Fiscal Year 2023)
- Macy’s, Inc. net sales decreased 3.5 percent y/y to $22.3 billion, with comparable sales down 2.0 percent on an owned basis and down 0.9 percent on an owned-plus-licensed-plus-marketplace basis.
- Comparable owned-plus-licensed-plus-marketplace sales growth at Macy’s First 50 locations, Bloomingdale’s, and Bluemercury was offset primarily by weakness in Macy’s non-First 50 locations and digital channel.
- Macy’s, Inc. go-forward business comparable sales were down 1.7 percent on an owned basis and down 0.6 percent on an owned-plus-licensed-plus-marketplace basis. By nameplate:
- Macy’s banner net sales were down 4.2 percent, with comparable sales down 2.6 percent on an owned basis and down 1.6 percent on an owned-plus-licensed-plus-marketplace basis.
- Macy’s go-forward business comparable sales were down 2.4 percent on an owned basis and down 1.3 percent on an owned-plus-licensed-plus-marketplace basis.
- First 50 locations comparable sales were up 1.6 percent on an owned basis and up 1.8 percent on an owned-plus-licensed basis.
- Bloomingdale’s net sales were up 1.0 percent, with comparable sales up 1.7 percent on an owned basis and up 2.5 percent on an owned-plus-licensed-plus-marketplace basis.
- Bluemercury net sales were up 2.8 percent and comparable sales were up 4.0 percent on an owned basis.
- Other revenue of $713 million decreased $61 million, or 7.9 percent. Within Other revenue:
- Credit card revenues, net decreased $82 million, or 13.2 percent, to $537 million, primarily driven by higher net credit losses year-over-year.
- Macy’s Media Network revenue, net rose $21 million, or 13.5 percent, to $176 million, reflecting growth in number of advertisers and campaign counts year-over-year.
- Gross margin was flat at 38.4 percent of net sales. Merchandise margin declined 10 basis points. The change relative to the prior-year gross margin was impacted by Macy’s nameplate’s conversion to cost accounting. Additionally, 2024 merchandise margin was negatively impacted by product mix. These factors were said to be partially offset by favorable shortage and liquidations. The decline in merchandise margin was reportedly offset by efficiencies in the company’s fulfillment network and lower shipped sales volume.
- SG&A expense decreased $45 million y/y to $8.3 billion. The decline in SG&A expense reportedly reflected the company’s continued cost controls while focusing on customer-facing investments that will drive future sales. As a percent of total revenue, SG&A expense increased 110 basis points to 36.2 percent due to lower total revenue.
- Asset sale gains of $144 million were $83 million higher. As part of its Bold New Chapter strategy, in fiscal year 2024, the company removed 64 non-go-forward Macy’s locations which contributed to current year asset sale gains.
- GAAP diluted EPS was $2.07 and Adjusted diluted EPS was $2.64, compared to GAAP diluted EPS of 16 cents and Adjusted diluted EPS of $3.28 in fiscal year 2023.
Balance Sheet and Liquidity
The company ended fiscal year 2024 with cash and cash equivalents of $1.3 billion. As of the end of fiscal 2024, under its asset-based credit facility, borrowing availability was $2.5 billion, which considers reductions due to letters of credit and inventory levels impacting the borrowing base.
Merchandise inventories increased 2.5 percent year-over-year. The conversion to cost accounting is estimated to account for roughly half of the increase from the prior year, with the remainder reflecting the timing of spring receipts. The company believes the composition and level of inventories is well-positioned heading into fiscal year 2025.
As of the end of fiscal year 2024, total debt was $2.8 billion, with no outstanding short-term borrowings under the company’s asset-based credit facility and no material long-term debt maturities until 2027.
2025 Guidance
The company provided its annual fiscal year 2025 guidance. The company believes that Macy’s, Inc. go-forward business comparable owned-plus-licensed-plus-marketplace sales and Core Adjusted EBITDA on a dollar and percent of total revenue basis, defined as Adjusted EBITDA excluding asset sale gains, are said to be the best proxy to measure fundamental improvements during the company’s stabilization and pursuit of profitable growth.
For Macy’s, Inc. the company expects:
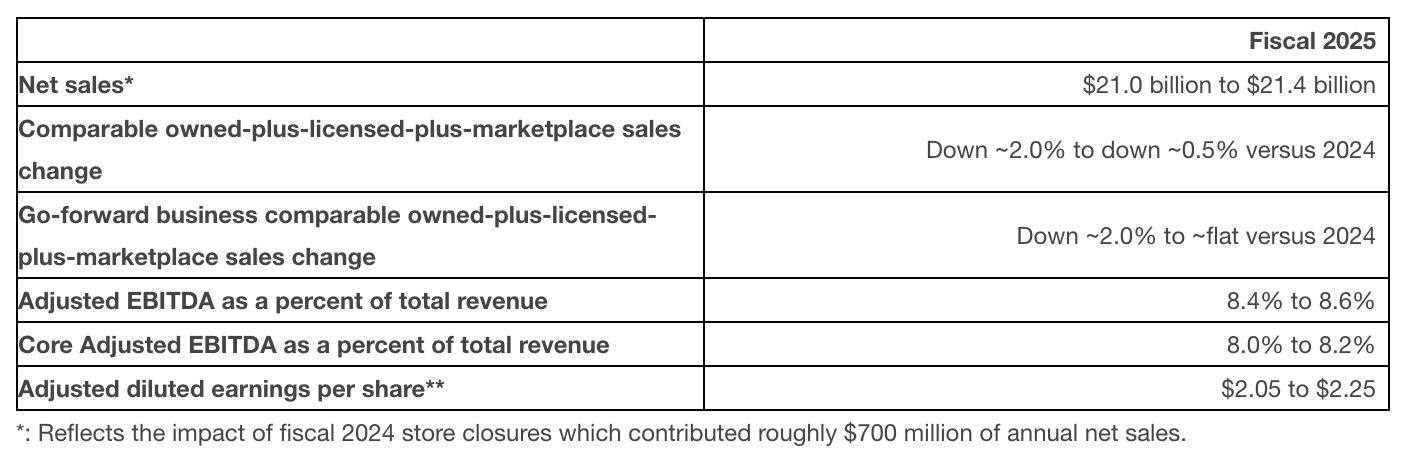
Image courtesy Macy’s, Inc.