
Yeti Holdings, Inc. saw fourth quarter sales increase 5 percent to $546.5 million, compared to $519.8 million in the prior-year Q4 period. Recall reserves unfavorably impacted sales by $8.8 million in the fourth quarter of 2024 and favorably impacted sales by $2.8 million in the prior-year quarter.
Adjusted sales, which exclude the impacts of the recall reserves in both the current and prior-year quarters, increased 7 percent to $555.4 million.
Sales and adjusted sales for the fourth quarter of 2024 and 2023 include $1.7 million and $6.5 million, respectively, of sales related to gift card redemptions in connection with recall remedies.
The results of Fiscal 2024 and Fiscal 2023 include the impact of product recalls on certain soft coolers, or the “product recalls” unless indicated otherwise. The reserve for the estimated expenses related to the product recalls was established in Fiscal 2022.
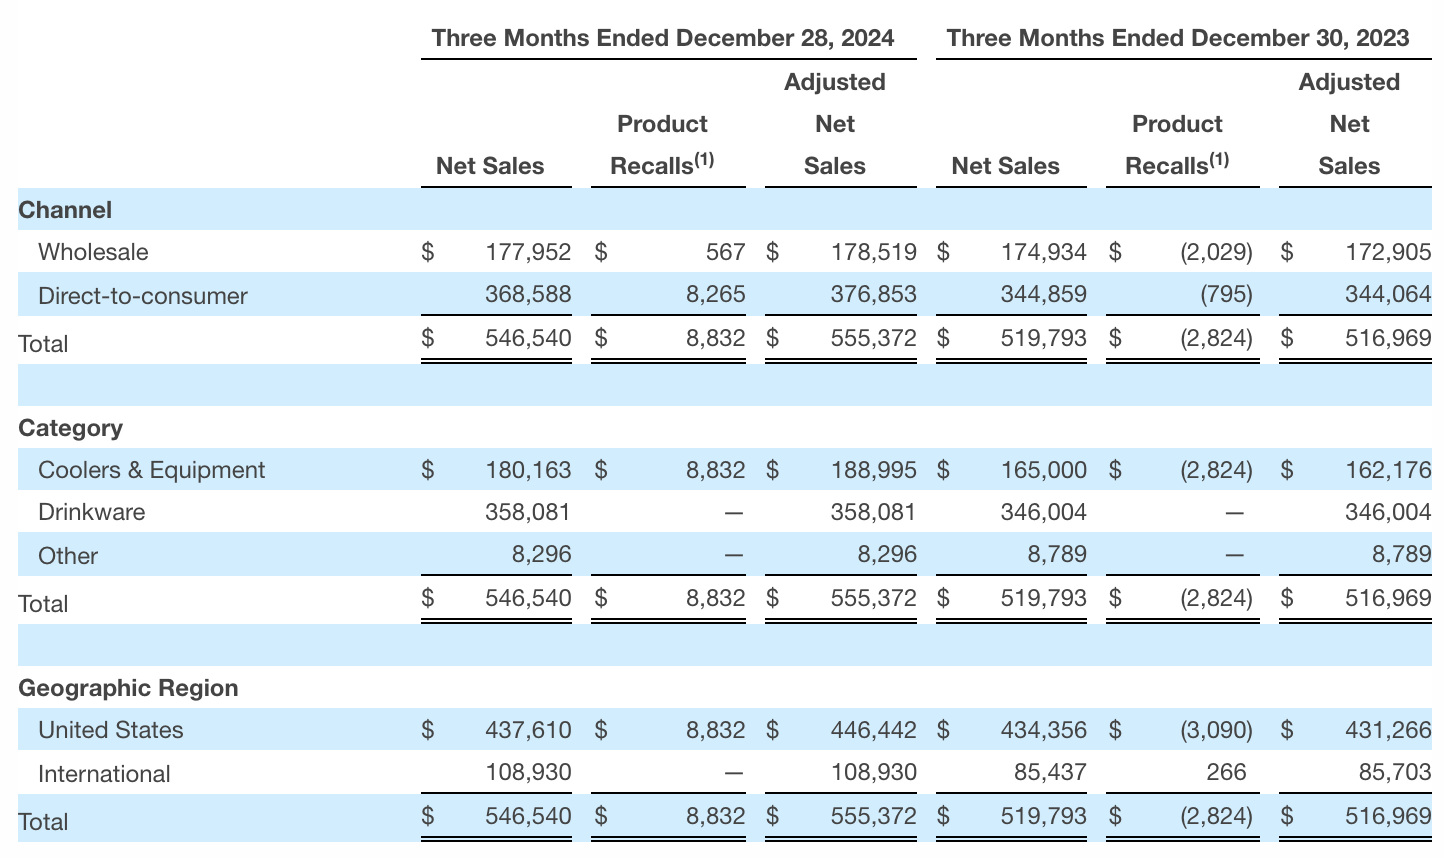
Channel Sales
Direct-to-Consumer (DTC) channel sales increased 7 percent to $368.6 million in Q4, compared to $344.9 million in the prior-year Q4 period, reportedly due to growth in both the Coolers & Equipment segment and Drinkware segment. Excluding the impacts related to the recall reserves, DTC channel adjusted sales increased 10 percent to $376.9 million in the quarter.
Wholesale channel sales increased 2 percent to $178.0 million, compared to $174.9 million in the prior-year Q4 period, said to be primarily due to growth in Coolers & Equipment. Excluding the impacts related to the recall reserves, Wholesale channel adjusted sales increased 3 percent to $178.5 million in Q4.
Category Sales
Drinkware sales increased 3 percent to $358.1 million in Q4, compared to $346.0 million in the prior-year Q4 period, reportedly driven by the continued expansion and innovation of our Drinkware product offerings and new seasonal colorways.
Coolers & Equipment sales increased 9 percent to $180.2 million, compared to $165.0 million in the prior-year Q4 period, driven by strong performance in bags and hard coolers. Excluding the impacts of the recall reserves, Coolers & Equipment adjusted sales increased 17 percent to $189.0 million in the fourth quarter.
Region Sales
Net sales in the U.S. increased 1 percent to $437.6 million in Q4, compared to $434.4 million in the prior-year Q4 period. Excluding the impacts related to the recall reserves, adjusted net sales in the U.S. increased 4 percent to $446.4 million.
International net sales increased 27 percent to $108.9 million, compared to $85.4 million in the prior-year Q4 period. Excluding the impacts related to the recall reserves, international adjusted net sales in the increased 27 percent to $108.9 million.
Income Statement Summary
Gross profit increased 4 percent to $326.4 million, or 59.7 percent of sales, in the fourth quarter, compared to $315.2 million, or 60.6 percent of sales, in the fourth quarter of 2023, resulting in a decline of 90 basis points to gross margin.
The recall reserves unfavorably impacted gross profit by $8.1 million in the fourth quarter of 2024 and favorably impacted gross profit by $4.1 million in the prior-year Q4 period, for a net unfavorable impact of 90 basis point to gross margin. Excluding the impact of the recall reserves, gross margin was flat as lower inbound freight costs and lower product costs were offset by higher customization costs and higher other costs.
Adjusted gross profit increased 8 percent to $334.5 million, or 60.2 percent of adjusted sales, compared to $311.1 million, or 60.2 percent of adjusted sales, in the fourth quarter of 2023.
Selling, general, and administrative (SG&A) expenses increased 12 percent to $243.9 million, compared to $217.1 million in the fourth quarter of 2023. As a percentage of sales, SG&A expenses increased 280 basis points to 44.6 percent from 41.8 percent in the prior-year Q4 period. Excluding the impacts of the recall reserves, SG&A expenses increased $24.2 million primarily due to higher employee costs and marketing expenses.
Adjusted SG&A expenses increased 7 percent to $223.9 million, compared to $208.5 million in the fourth quarter of 2023. As a percentage of adjusted sales, adjusted SG&A expenses were flat at 40.3 percent as distribution and fulfillment expenses leverage on higher sales was offset by higher employee costs and other expenses.
Operating income decreased 16 percent to $82.5 million, or 15.1 percent of sales, in Q4, compared to $98.2 million, or 18.9 percent of sales during the prior-year Q4 period.
Adjusted operating income increased 8 percent to $110.6 million, or 19.9 percent of adjusted sales, in Q4, compared to $102.6 million, or 19.8 percent of adjusted sales during the prior-year Q4 period.
Other expense of $13.5 million compared to other income of $4.2 million in the fourth quarter of 2023, said to be primarily due to unrealized foreign currency losses related to intercompany balances.
Net income decreased 32 percent to $53.2 million, or 9.7 percent of sales, in the fourth quarter, compared to $78.6 million, or 15.1 percent of sales in the prior-year Q4 period. Net income per diluted share decreased 30 percent to 63 cents, compared to 90 cents in the prior-year Q4 period.
Adjusted net income increased 7 percent to $84.6 million, or 15.2 percent of adjusted sales, in the fourth quarter, compared to $78.8 million, or 15.2 percent of adjusted sales, in the prior-year Q4 period.
Adjusted net income per diluted share increased 11 percent to $1.00 in Q4, compared to 90 cents per diluted share in the prior-year Q4 period.
Fiscal Year 2024 Highlights
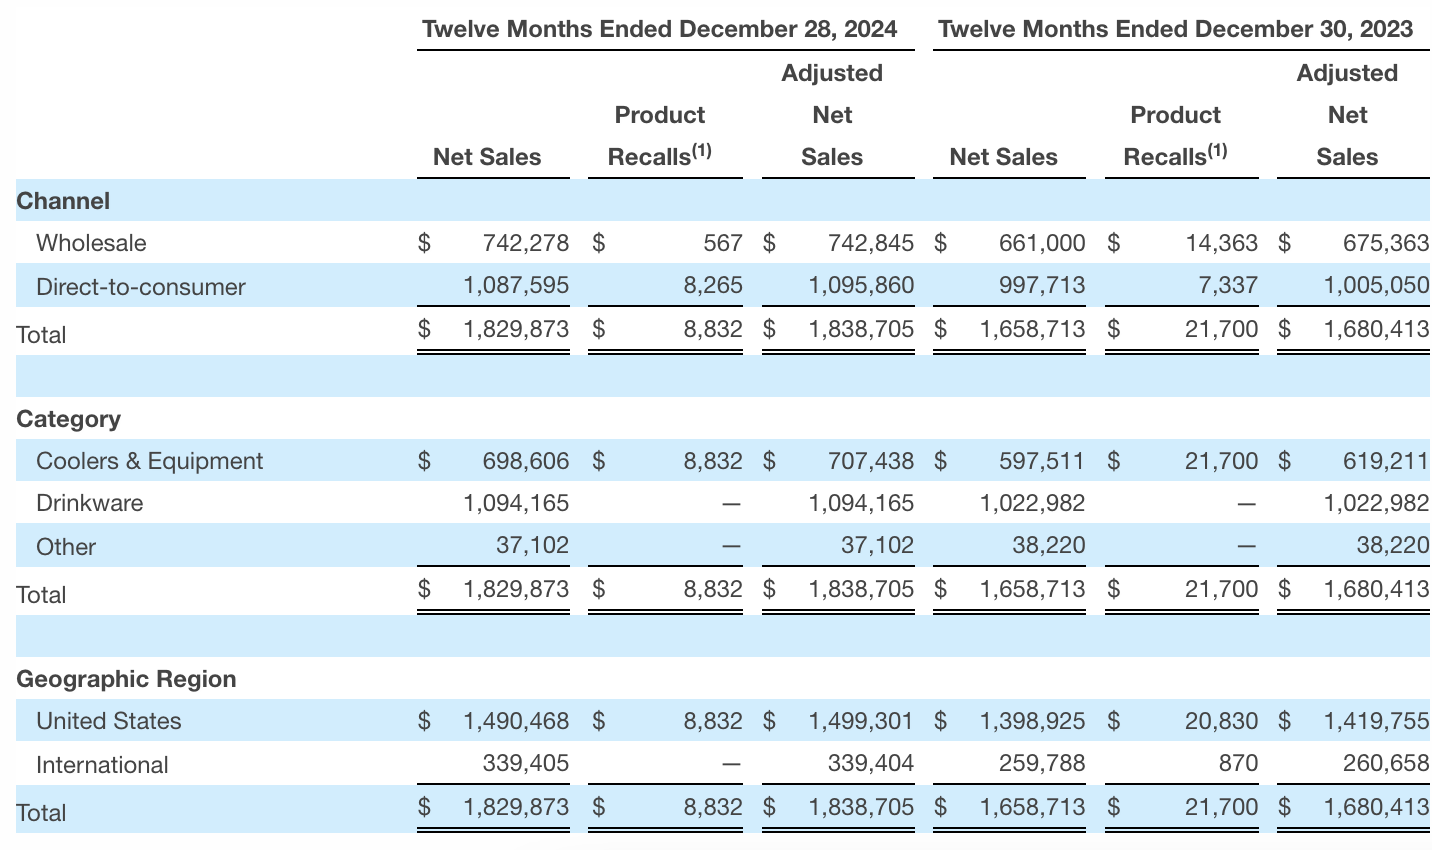
- Full year net sales increased 10 percent; Adjusted net sales, which exclude recall reserve adjustments, increased 9 percent.
- Gross margin expanded 120 basis points to 58.1 percent; Adjusted gross margin expanded 170 basis points to 58.6 percent.
- Operating margin contracted 20 basis points to 13.4 percent; Adjusted operating margin expanded 120 basis points to 16.8 percent.
- Full year EPS increased 6 percent to $2.05; Adjusted EPS increased 21 percent to $2.73.
- Operating cash flow of $261.4 million; Free cash flow of $219.6 million.
Balance Sheet and Other Highlights
During Fiscal 2024, Yeti spent $200 million on accelerated share repurchase agreements and completed the acquisitions of Mystery Ranch, Ltd., Butter Pat Industries, LLC, and the capabilities, technology, and intellectual property to develop a unique powered cooler platform.
Cash was $358.8 million at year-end, compared to $439.0 million at the end of Fiscal 2023.
Inventory decreased 8 percent to $310.1 million at year-end, compared to $337.2 million at the end of Fiscal 2023.
Total debt, excluding finance leases and unamortized deferred financing fees, was $78.0 million, compared to $82.3 million at the end of Fiscal 2023.
Fiscal 2025 Outlook
Although Yeti expects the near-term market, particularly in the U.S., to be pressured by many of the same forces seen in the fourth quarter and much of 2024, the company’s strategy reportedly remains the same, enabling it to continue to deliver long-term growth.
“Along with our top-line growth, we also expect adjusted operating margin expansion in 2025, while also delivering strong earnings growth. We do expect FX headwinds this year with our fast-growing international business, so we plan to provide insights as to the impact that FX is having on our results. In addition, after two years of excellent free cash flow generation, we expect to have another strong free cash flow year in 2025, giving us the potential to both drive future growth while continuing to return capital to our shareholders. Finally, and most importantly, we will focus on growing and strengthening the YETI brand around the globe.”
For Fiscal 2025, a 53-week period, compared to a 52-week period in Fiscal 2024, Yeti expects:
- Adjusted sales to increase between 5 percent and 7percent, which reflects an FX headwind of approximately 100 basis points of growth;
- Adjusted operating income to increase between 5.5 percent and 7.5 percent, which reflects an FX headwind of approximately 350 basis points of growth;
- An effective tax rate of approximately 24.5 percent (compared to 24.5 percent in the prior year);
- Adjusted net income per diluted share between $2.90 and $2.95, reflecting a 6 percent to 8 percent increase, and which reflects an FX headwind of approximately 10 cents. Yeti said this outlook does not assume any impact from potential future share repurchases;
- Diluted weighted average shares outstanding of approximately 84.3 million;
- Capital expenditures between $60 million and $70 million, primarily to support investments in technology, new product innovation, and our supply chain; and
- Free cash flow of approximately $200 million.
Product Recall Reserves
The results of Fiscal 2024 and Fiscal 2023 include the impact of product recalls on certain soft coolers, or the “product recalls” unless indicated otherwise. The reserve for the estimated expenses related to the product recalls was established in Fiscal 2022.
During the fourth quarter of 2024, Yeti re-evaluated the assumptions of its recall reserves in response to experiencing higher than anticipated consumer recall participation rates during the year, and as a result increased the estimated recall expense reserve by $9.9 million. The reserve for the estimated product recall expense was $12.1 million and $13.1 million as of December 28, 2024 and December 30, 2023, respectively.
Yeti, Inc. recorded the following impacts as a result of recall reserve adjustments. These impacts are excluded from the company’s non-GAAP results:
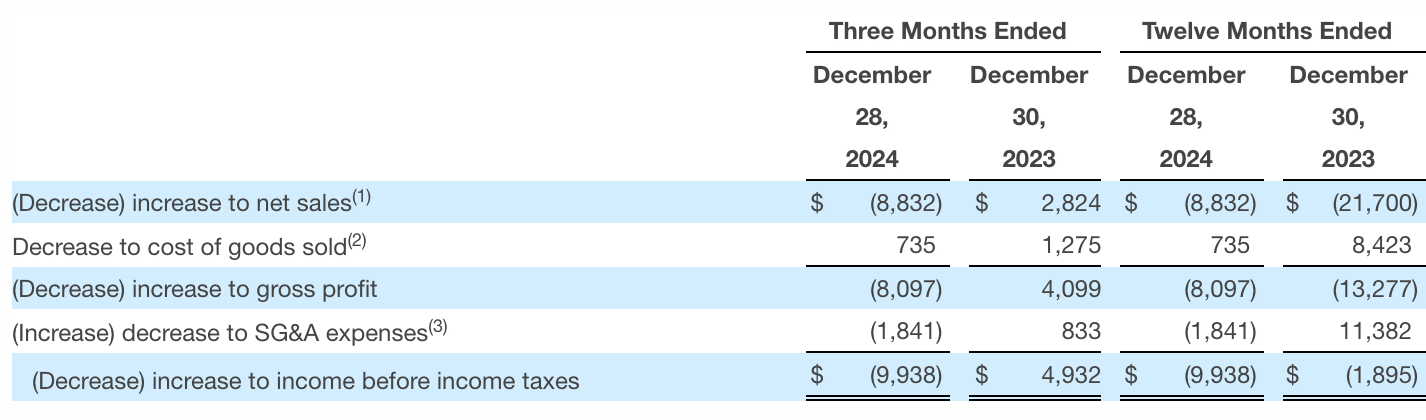
Image and data tables courtesy Yeti, Inc.