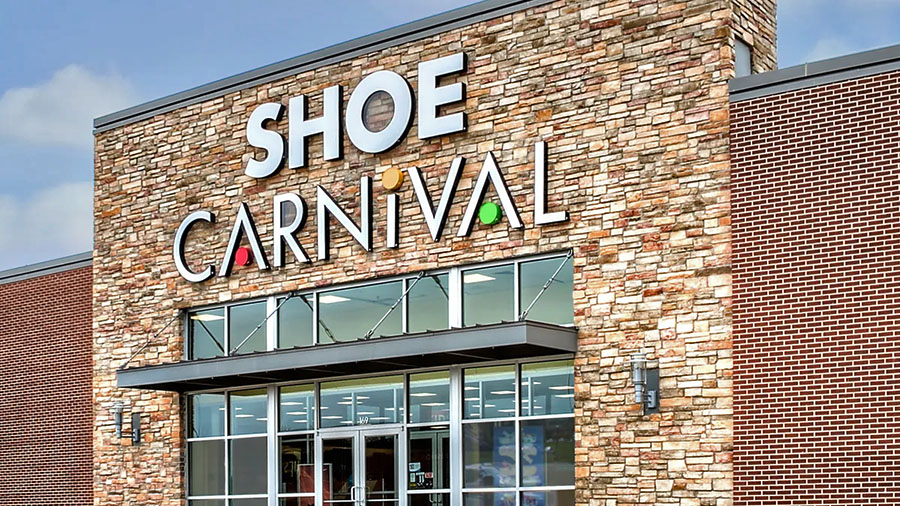
Shoe Carnival, Inc., parent of the Shoe Carnival, Rogan’s, and Shoe Station retail banners, reported that net sales in the third quarter were $306.9 million compared to $319.9 million in the third quarter of 2023. This reflects the impact of the retail calendar shift, which resulted in approximately $20 million of net sales moving out of the third quarter of 2024 compared to the prior year.
Without the impact of the retail calendar shift, net sales increased by 2.2 percent versus the prior-year third quarter.
On a year-to-date (YTD) basis, which now includes the material impacts of the retail calendar shift that increased second-quarter net sales and decreased third-quarter net sales, net sales totaled $939.9 million, increasing 4.9 percent versus the prior-year YTD period.
Net sales in the third quarter were led by a strong back-to-school performance, comparable store net sales growth in August, and net sales from the February 2024 acquisition of Rogan Shoes, Inc.
Comparable store net sales in September and October were significantly impacted by two hurricanes that disrupted many of the company’s store operations, customer shopping trends and persistently warm weather that delayed the winter boot shopping season.
Comparable store net sales for the thirteen-week period ended November 2, 2024 declined 4.1 percent compared to the thirteen-week period ended November 4, 2023.
“Our Back-to-School results were strong, with comparable store sales growth across our banners and robust margins,” said Mark Worden, president and CEO of Shoe Carnival, Inc. “Our flexible digital-first marketing campaign and great brand assortment drove demand during this peak shopping period and profitability in line with expectations for the third quarter.”
Gross profit margin Q3 was 36.0 percent of sales, marking the 15th consecutive quarter the company’s gross profit margin exceeded 35 percent. Gross profit margin was lower in the quarter by 80 basis points compared to the prior-year Q3 period, said to be primarily due to buying, distribution and occupancy costs (BD&O) from operating more stores and the deleveraging effect of lower net sales in the quarter, as impacted by the retail calendar shift. Year-to-date 2024 gross profit margin was flat versus the prior-year YTD period.
As a percent of net sales, SG&A expenses in the quarter were 28.0 percent compared to 28.1 percent in the prior-year Q3 period, reflecting ten basis points of leverage on the lower, shifted sales base. The decrease in SG&A expenses was due primarily to lower selling costs at Shoe Carnival and Shoe Station banner stores, which in the quarter more than offset the costs of operating the recently acquired Rogan’s stores. During third quarter 2024, the company said it had captured synergies within Rogan’s and was ahead of schedule in integrating the acquired operations.
Third quarter 2024 operating income totaled $24.5 million, as compared to $27.9 million in third quarter 2023, reportedly impacted by the lower net sales from the calendar shift, partially offset by growth from the Rogan’s acquisition and related synergies and lower SG&A.
Third quarter 2024 net income was in line with the company’s expectation at $19.2 million, or 70 cents per diluted share (EPS), compared to third quarter 2023 net income of $21.9 million, or 80 cents per diluted share. In YTD 2024, net income and EPS have increased 2.2 percent and 1.9 percent, respectively, versus the prior-year YTD period.
Third quarter 2024 GAAP results included $0.3 million in expenses related to Rogan’s acquisition, of which $0.2 million was included in the cost of sales and $0.1 million was included in SG&A. On an adjusted basis, excluding these expenses, third quarter Adjusted EPS was 71 cents per share and reportedly in line with the company’s expectation. Year-to-date 2024 Adjusted EPS totaled $2.19 per share, an increase of 3.8 percent versus the prior-year YTD period.
Rogan’s Acquisition
The company continues to expect the Rogan’s acquisition to deliver net sales of over $80 million in Fiscal 2024, with $22.3 million of net sales in third quarter 2024 and $63.9 million year-to-date in 2024.
The company has completed the integration of store operations, marketing, e-commerce platforms, point-of-sale systems, merchandising, and back office. As a result of this accelerated integration, synergy capture has also accelerated into Fiscal 2024 ahead of expectations.
The company continues to expect total synergies of approximately $2.5 million, with approximately half of the synergies now expected to be achieved in the second half of Fiscal 2024 in both BD&O and SG&A with a significant portion of that captured in third quarter 2024.
Store Count and Rebanner Growth Strategy
As of November 21, 2024, the company operated 431 stores, with 361 Shoe Carnival stores, 42 Shoe Station stores and the 28 Rogan’s locations. One new Shoe Station store opened in third quarter 2024 in Tennessee, expanding this banner into a new market.
The company advanced its store rebanner growth strategy during the quarter, with seven Shoe Carnival stores being rebannered to Shoe Station stores.
“During the quarter, we also accelerated testing of our store rebanner growth strategy with the addition of seven stores, bringing the total number of rebannered stores from Shoe Carnival to Shoe Station to ten this year,” offered Worden. Early results exceeded our sales and profit success criteria, encouraging the team to expand the rebanner test to an additional 25 stores during the first half of 2025 as part of our long-term vision to be the nation’s leading family footwear retailer.”
Through third quarter 2024, rebannered stores have outperformed expectations. Stores with more than one fiscal month of operating history have experienced both a net sales increase and store-level profitability increase of over 10 percent. Based on the successful results of the strategy to date, the company plans to rebanner 25 additional Shoe Carnival stores to Shoe Station stores in the first half of Fiscal 2025.
Share Repurchase Program
As of November 21, 2024, the company had $50 million available for future repurchases under its share repurchase program. During third quarter 2024, the company did not repurchase any shares.
Capital Management and Cash Flow
The 2023 fiscal year-end marked the 19th consecutive year the company ended a year with no debt, and through third quarter 2024, the company continued funding its operations and growth investments from operating cash flow and without debt.
At the end of third quarter 2024, the company had approximately $91.1 million of cash, cash equivalents and marketable securities, an increase of $20.0 million compared to the end of the Q3 period last year. Operating cash flow year-to-date 2024 totaled $58.1 million.
Fiscal 2024 Outlook
Based on year-to-date results, including third-quarter profitability in line with the company’s expectation and net sales lower than the company’s expectation, the company is providing guidance ranges as follows:
- Net Sales: Updated range to $1.20 billion to $1.23 billion, representing growth of 2 percent to 4.5 percent versus Fiscal 2023. (Prior guidance range $1.23 billion to $1.25 billion)
- Gross Profit Margin: Expected to be approximately even with Fiscal 2023—no change.
- SG&A Expenses: As a percent of net sales, SG&A is expected to be approximately 30 basis points higher than Fiscal 2023. Previous guidance is approximately 40 basis points higher than Fiscal 2023.
- Income Tax Rate: Expected to be approximately 25.6 percent to 26 percent in Fiscal 2024. Prior guidance is approximately 26 percent.
- GAAP EPS: Expected to be in a range of $2.55 to $2.70—no change.
- Adjusted EPS: Expected to be in a range of $2.60 to $2.75—no change.
The company noted that Fiscal 2024 is a 52-week year and compares to a 53-week year in Fiscal 2023. Combined with the impact of the retail calendar shift versus the prior year, resulted in the loss of approximately $20 million in net sales in fourth quarter 2024 compared to fourth quarter 2023 with an estimated negative impact of approximately 10 cents on EPS.
Image courtesy Shoe Carnival, Inc.


