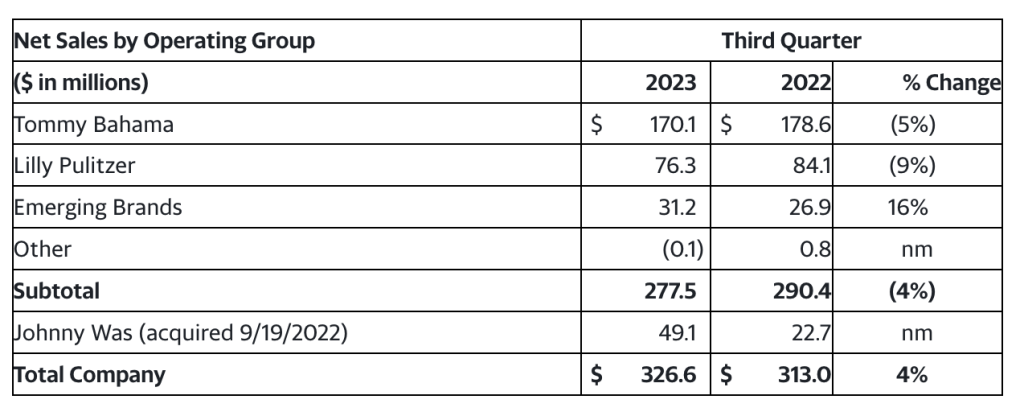
Oxford Industries, Inc., the parent of Tommy Bahama, Lilly Pulitzer and Johnny Was brands, reported that consolidated net sales in the fiscal third quarter increased 4 percent to $327 million, compared to $313 million in the third quarter of fiscal 2022.
Full-price direct-to-consumer (DTC) sales increased 9 percent to $194 million versus the year-ago quarter, including $38 million of DTC sales in Johnny Was and a 3 percent aggregate decrease in full-price DTC sales in the company’s other businesses.
Full-price retail sales of $105 million were 8 percent, or $8 million, higher than the prior-year period, which includes full-price retail sales in Johnny Was of $18 million for the third quarter this year. Full-price retail sales in the company’s other businesses decreased by 2 percent.
Full-price e-commerce sales grew 11 percent, or $9 million, to $89 million versus last year’s Q3 period, which includes full-price e-commerce sales in Johnny Was of $20 million. Full-price e-commerce sales in the company’s other businesses decreased by 3 percent.
Outlet sales were $17 million, a 13 percent increase, or $2 million, versus prior-year Q3 results due to the addition of Johnny Was and a 6 percent increase in Tommy Bahama.
There were $25 million of Lilly Pulitzer e-commerce flash sales in the third quarter compared to $28 million of Lilly Pulitzer flash sales in the third quarter of fiscal 2022.
Food and beverage sales declined 3 percent, or $1 million, to $23 million versus last year’s Q3, primarily due to remodels of certain locations and the impact of the Maui wildfires.
Wholesale sales of $69 million were 1 percent, or $1 million, lower than the third quarter of fiscal 2022. Johnny Was contributed wholesale sales of $10 million for the third quarter of fiscal 2023, with the other businesses in the aggregate decreasing by 9 percent.
 “We are pleased to deliver another quarter of solid results which were squarely in our sales and EPS forecast ranges and come on top of 12 percent positive comps during the same period last year,” expressed company Chairman and CEO Tom Chubb. “We were able to do this by leveraging the strength of our powerful brands to send clear and consistent brand messages that inspire and resonate with customers and create desire for our products and services in a market where the consumer is more cautious.”
Gross margin was 62.9 percent of sales on a GAAP basis, compared to 63.2 percent in the third quarter of fiscal 2022. The decrease in gross margin was primarily due to a $4 million higher LIFO accounting charge in the third quarter this year compared to the third quarter last year.
Adjusted gross margin, which excludes the effect of LIFO accounting, expanded to 64.0 percent compared to 63.4 percent on an adjusted basis in the third quarter last year due to a full quarter of Johnny Was sales that yielded a higher gross margin and a change in sales mix with DTC sales comprising a larger proportion of total sales.
SG&A was $195 million in Q3 compared to $175 million in Q3 last year. On an adjusted basis, SG&A was $191 million compared to $171 million in the prior-year period, reportedly due primarily to a $17 million increase in Johnny Was resulting from a full third quarter of Johnny Was expenses in 2023 compared to a partial third quarter in 2022.
Royalties and other operating income decreased by $1 million to $4 million. This decrease was primarily driven by lower sales of Tommy Bahama’s licensing partners.
Operating income was $14 million, or 4.4 percent of net sales, in Q3, compared to $27 million in the third quarter of fiscal 2022. On an adjusted basis, operating income was $21 million, or 6.6 percent of net sales, compared to $32 million in last year’s third quarter.
Year-over-year operating income results reflect higher SG&A as the company invests in the business, partially offset by sales growth.
Interest expense increased by less than $1 million compared to the prior-year period. The increased interest expense was due to higher average debt levels the company incurred in acquiring Johnny Was and higher interest rates.
The effective tax rate was 18.6 percent compared to 26.1 percent for the prior-year period. Due to the lower earnings during the third quarter as compared to our other fiscal quarters, certain discrete or other items recognized in the third quarter may have a more pronounced impact, resulting in the effective tax rate of the third quarter not being indicative of the effective tax rate for the full fiscal year.
EPS on a GAAP basis was 68 cents per share in Q3, compared to $1.22 per share in the third quarter of fiscal 2022. On an adjusted basis, EPS was $1.01 a share compared to $1.46 a share in the third quarter of fiscal 2022.
Balance Sheet and Liquidity
Inventory decreased $14 million on a LIFO basis and $9 million, or 4 percent, on a FIFO basis compared to the end of the third quarter of fiscal 2022. Inventories decreased in all operating groups primarily due to continuing initiatives to focus on closely managing inventory purchases and reducing on-hand inventory levels.
During the first nine months of fiscal 2023, cash flow from operations was $169 million compared to $86 million in the first nine months of fiscal 2022. The cash flow from operations in the first nine months of fiscal 2023 provided sufficient cash to fund $54 million of capital expenditures, $31 million of dividends, $20 million of share repurchases and $53 million of debt reduction.
As of October 28, 2023, the company had $66 million of borrowings outstanding under its revolving credit agreement, compared to $130 million of borrowings outstanding at the end of the third quarter of last year. The company also had $8 million of cash and cash equivalents versus $15 million of cash and cash equivalents at the end of the third quarter of fiscal 2022.
Dividends
The Board of Directors declared a quarterly cash dividend of $0.65 per share. The dividend is payable on February 2, 2024 to shareholders of record as of the close of business on January 19, 2024. The company has paid quarterly dividends since it became publicly owned in 1960.
Outlook
The company moderated its sales and EPS guidance for fiscal 2023, ending on February 3, 2024.
Oxford now expects net sales in the range of $1.57 billion to $1.59 billion, compared to net sales of $1.41 billion in fiscal 2022. In fiscal 2023, GAAP EPS is expected to be between $9.25 and $9.45 a share compared to fiscal 2022 GAAP EPS of $10.19 a share. Adjusted EPS is expected to be between $10.10 and $10.30 a share, compared to fiscal 2022 adjusted EPS of $10.88 a share.
For the fourth quarter of fiscal 2023, the company expects net sales to be between $403 million and $423 million, compared to net sales of $382 million in the fourth quarter of fiscal 2022. GAAP EPS is expected to be in a range of $1.67 to $1.87 per share in the fourth quarter, compared to GAAP EPS of $2.00 in the fourth quarter of fiscal 2022. Adjusted EPS is expected to be between $1.83 and $2.03 a share compared to adjusted EPS of $2.28 in the fourth quarter of fiscal 2022.
Oxford anticipates interest expense of $6 million in fiscal 2023, including the $5 million in the first nine months of fiscal 2023, as strong cash flows allow for continued debt reduction during fiscal 2023.
The company’s effective tax rate is expected to be approximately 24 percent for the full year of fiscal 2023.
Capital expenditures in fiscal 2023, including the $54 million in the first nine months of fiscal 2023, are expected to be approximately $80 million compared to $47 million in fiscal 2022. The planned increase is primarily due to increased investment in new brick-and-mortar stores, food and beverage locations, certain relocations and remodels of existing locations, and various technology systems initiatives.
Photo and chart courtesy Oxford Industries


