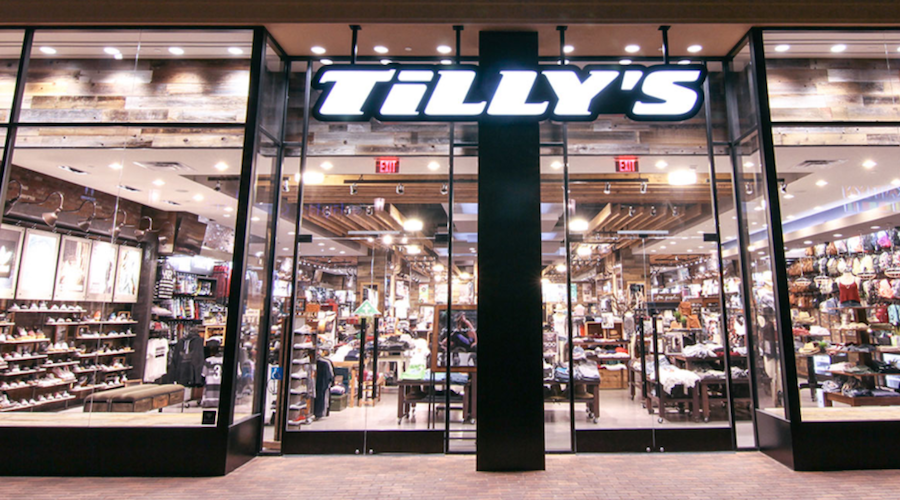
Tilly’s Inc. reported earnings rose 117.2 percent due to a sharp reduction in operating expenses.
On January 31, Tilly’s raised its fourth-quarter guidance due to improving product margins and expense controls. The action sports retailer said it expected EPS to come in the range of 21 to 22 cents a share, up from previous guidance of 15 to 20 cents.
“We finished fiscal 2016 with three consecutive quarters of year over year operating income growth and our first annual improvement in operating income of the last five years,” stated Ed Thomas, president and chief executive officer. “Our strong balance sheet enabled us to reward shareholders with a $20 million special dividend in February. While we are encouraged by these results, we will continue to seek ways to improve profitability and continue our progress during fiscal 2017.”
Fourth Quarter Results Overview
The following comparisons refer to operating results for the fourth quarter of fiscal 2016 versus the fourth quarter of fiscal 2015 ended January 30, 2016:
- Total net sales were $160.2 million, an increase of 0.7 percent from $159.1 million last year.
- Comparable store sales, which include e-commerce sales, increased 0.1 percent. Comparable store sales increased 0.9 percent in the fourth quarter last year.
- Gross margin, or gross profit as a percentage of net sales, decreased to 30.6 percent from 31.4 percent last year. The 80 basis point decrease in gross margin was primarily attributable to a 60 basis point decline in product margins from increased markdowns and a 20 basis point increase in buying, distribution and occupancy costs.
- Selling, general and administrative expenses (SG&A) were $38.7 million, a decrease of $1.8 million from $40.5 million last year. As a percentage of net sales, SG&A improved 130 basis points to 24.1 percent from 25.4 percent last year. This improvement was primarily driven by the combination of more efficient marketing spend, lower non-cash store impairment charges, and corporate payroll savings.
- Operating income was $10.4 million, or 6.5 percent of net sales, compared to $9.5 million, or 6.0 percent of net sales, last year. The 50 basis point increase in our operating margin was primarily attributable to the reductions in SG&A noted above.
Our effective tax rate was 40.2 percent compared to 69.6 percent last year. Last year’s tax rate was higher primarily due to increased discrete items related to stock option expirations. - Net income was $6.3 million, or 22 cents per diluted share, compared to $2.9 million, or 10 cents per diluted share, last year.
Fiscal 2016 Full Year Results Overview
The following comparisons refer to operating results for fiscal 2016 versus fiscal 2015 ended January 30, 2016:
- Total net sales were $569 million, an increase of 3.3 percent from $551 million last year.
- Comparable store sales, which include e-commerce sales, increased 0.5 percent. Comparable store sales increased 1.2 percent in fiscal 2015.
- Gross margin, or gross profit as a percentage of net sales, was 29.6 percent compared to 30.4 percent last year. This 80 basis point decrease was primarily attributable to a decline in product margins as a result of increased markdowns.
- SG&A was $149.1 million, a slight decrease from $149.2 million last year. As a percentage of net sales, SG&A improved 90 basis points to 26.2 percent from 27.1 percent last year. This improvement was primarily driven by the combination of more efficient marketing spend, lower stock-based compensation, and corporate payroll savings.
- Operating income was $19.3 million, an increase of $1.2 million from $18.1 million last year. Operating margin improved 10 basis points to 3.4 percent of net sales compared 3.3 percent last year.
- Income tax expense was $8.3 million, or 42.2 percent of pre-tax income, compared to $10.6 million, or 58.4 percent of pre-tax income, last year. Last year’s tax rate was higher primarily due to increased discrete items related to stock option expirations.
- Net income was $11.4 million, or 40 cents per diluted share, compared to $7.5 million, or 27 cents per diluted share, last year.
Balance Sheet and Liquidity
As of January 28, 2017, the company had $134 million of cash and marketable securities and no debt outstanding under its revolving credit facility. This compares to $101 million of cash and marketable securities and no debt outstanding as of January 30, 2016. As previously announced, the company paid a special cash dividend of approximately $20 million to shareholders on February 24, 2017.
Fiscal 2017 First Quarter Outlook
The company’s quarter-to-date comparable store sales, including e-commerce, have decreased by a high single-digit percentage due to a later Easter versus the comparable prior year period and significant weather issues in its heritage markets of California, Arizona and Nevada during February. As a result, the company expects its first quarter comparable store sales to decrease by a low to mid single-digit percentage, operating loss to be in the range of $3 million to $7 million, and loss per share to be in the range of 7 to 15 cents. This compares to a loss of 10 cents s share for the first quarter of fiscal 2016. This assumes an anticipated effective tax rate of approximately 40 percent and weighted average shares of approximately 29 million.
Photo courtesy Tilly’s


