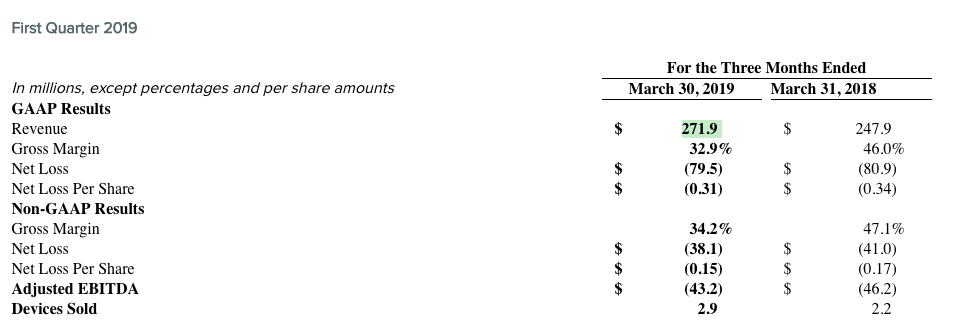
Fitbit Inc. slightly narrowed its loss in the first quarter to $38.1 million from $41 million a year ago as sales gained 9.7 percent.
Revenues came in at $271.9 million. Fitbit had said it expected revenues to increase 1 percent to 8 percent year over year, in the range of $250 million to $268 million. Non-GAAP net loss per share came in at 15 cents, slightly better than guidance calling for a loss in the range of 22 to 24 cents a share.
“We saw continued momentum across our business in the first quarter, with revenue up 10 percent and devices sold up 36 percent year-over-year. Smartwatch device sales increased 117 percent year-over-year and the introduction of our new trackers, Inspire and Inspire HR, helped spark the first quarter of year-over-year growth in tracker device sales in three years. In addition, our Fitbit Health Solutions business grew 70 percent with revenue of $30.5 million, demonstrating great progress towards our $100 million revenue target for 2019,” said James Park, co-founder and CEO. “New users are continuing to join the Fitbit platform with active users increasing in the first quarter, underscoring the effectiveness of our strategy to bring more users onto the Fitbit platform with the introduction of more accessible, affordable devices.”
First Quarter 2019 Financial Highlights
- Devices sold increased 36 percent year-over-year to 2.9 million. Average selling price decreased 19 percent year-over-year to $91 per device due to the introduction of more affordable devices, lowering the barriers to joining our community of active users.
- U.S. revenue represented 50 percent of total revenue or $135 million, down 3 percent year-over-year.
International revenue represented 50 percent of total revenue and grew 26 percent to $137 million: EMEA revenue grew 35 percent to $87 million; APAC revenue grew 24 percent to $34 million and Americas excluding U.S. revenue declined 5 percent to $15 million (all on a year-over-year basis). - New devices introduced in the past 12 months, Fitbit Charge 3™, Fitbit Inspire™, Fitbit Inspire HR™ and Fitbit Versa Lite Edition™, represented 67 percent of revenue.
- GAAP gross margin was 32.9 percent and non-GAAP gross margin was 34.2 percent. Both GAAP and non-GAAP gross margin were negatively impacted by the growing mix of smartwatch revenue and lower yields from our product launch.
- GAAP operating expenses represented 63.4 percent of revenue, declining 12.6 percent year-over-year to $172 million, and non-GAAP operating expenses represented 55.4 percent of revenue, declining 13.1 percent to $151 million.
- A $2.5 million severance charge related to the restructuring of our business further impacted GAAP operating expenses.
First Quarter 2019 Operational Highlights
- Smartwatch devices sold increased 117 percent year-over-year and represented 42 percent of revenue. Trackers sold increased 17 percent year-over-year, reversing a multi-year decline, and represented 58 percent of revenue.
- Strategy to increase affordability of our devices and grow our community of active users is working with growth in active users in the first quarter of 2019 on a year-over-year basis.
- Exited the first quarter of 2019 with a relatively clean retail channel.
- Fitbit Health Solutions grew 70 percent year-over-year, with strength overseas, and is on-track to deliver its full-year revenue target of approximately $100 million.
- 39 percent of activations came from repeat users; of the repeat users, 53 percent came from users who were inactive for 90 days or more.
Second Quarter 2019 Guidance
- We expect an increase in devices sold and a decline in average selling price, each year-over-year. We expect revenue to grow 2 percent to 7 percent year-over-year and to be in the range of $305 million to $320 million.
- We expect non-GAAP gross margin to be approximately 36 percent to 38 percent.
- We expect operating expenses to decline year-over-year, but to be materially higher than in the first quarter of 2019 due to higher sales and marketing expenses to support recent product introductions.
- We expect non-GAAP basic net loss per share in the range of $(0.20) to $(0.17).
- We expect adjusted EBITDA to be in the range of a loss of $(59) million to $(47) million.
- Non-GAAP effective tax rate of approximately 25 percent.
- Stock-based compensation expense of approximately $21 million and basic share count of approximately 258 million.
- We expect capital expenditures as a percentage of revenue of approximately 5 percent driven by the introduction of new products in the first quarter.
Fitbit maintained its guidance for the year.
Full Year 2019 Guidance
- We expect devices sold to increase in 2019, but average selling price to decline, each year-over-year driven by our intention to increase accessibility to our platform and grow our community of active users. We expect revenue to grow 1 percent to 4 percent year-over-year and to be in the range of $1.52 billion to $1.58 billion.
- We expect non-GAAP gross margin to be approximately 41 percent in the second half of the year and decline modestly to approximately 40 percent for the full year. Second half gross margin will benefit from operating leverage with higher revenue and improving yields. This will be partially offset by lower warranty benefit in 2019 compared to 2018 and device mix shift towards smartwatches. As the size of our Fitbit Health Solutions and software services business increases, we expect them to be gross margin accretive to overall company gross margin.
- We expect to continue to drive operating leverage into the business and are targeting operating expenses in the range of $660 million to $690 million.
- We expect adjusted EBITDA to be in the range of $(30) million to breakeven.
Non-GAAP effective tax rate of approximately 30 percent. We expect non-GAAP effective tax rate to be volatile driven by geographic mix of revenue, tax credits, and our shift to profitability. - Stock-based compensation expense of approximately $83 million and basic and diluted share count of approximately 260 and 276 million, respectively.
- Capital expenditures as a percentage of revenue of approximately 3 percent.
- With the year-over-year change in working capital anticipated to be less of a benefit in 2019 as compared to 2018, we expect free cash flow to be less than adjusted EBITDA, and in the range of approximately $(40) million to $(70) million.