Deckers Brands Inc. sharply raised its earnings guidance for its fiscal year after reporting earnings in the third quarter December 31 easily topped guidance. The gains were led by a 12.5 percent climb in wholesale revenue. Ugg’s sales grew 3.6 percent while Hoka One One’s revenues jumped 79.2 percent.
“With third quarter results delivered and an updated outlook for the full fiscal year 2019, I am pleased to say that we are now well ahead of schedule to deliver on the long term strategic goals we laid out two years ago,” said Dave Powers, president and chief executive officer. “Our third quarter results were propelled by the Ugg brand as it successfully delivered a compelling product offering, with thoughtful and controlled distribution. In addition, we achieved impressive growth with our Hoka One One and Koolaburra brands. These brands significantly contributed to the growth of our business and further highlight the momentum built throughout the entire Deckers organization.”
“In light of our strong results and the confidence in our strategies to produce strong cash flow over time, the Board of Directors has authorized an additional $261 million to our share repurchase program. Combined with the $89 million remaining under our current authorization, we now have the ability to repurchase a total of $350 million worth of shares in the future, as one avenue to effectively return value to shareholders.”
Third Quarter Fiscal 2019 Financial Review
- Net sales increased 7.8 percent to $873.8 million compared to $810.5 million for the same period last year. On a constant currency basis, net sales increased 7.7 percent.
- Gross margin was 53.8 percent compared to 52.2 percent for the same period last year.
- SG&A expenses were $225.4 million compared to $230.3 million for the same period last year.
- Non-GAAP SG&A expenses were $227.8 million this year compared to $220.4 million last year.
- Operating income was $244.7 million compared to $193.2 million for the same period last year.
- Non-GAAP operating income was $242.3 million this year compared to $203.1 million last year.
- Diluted earnings per share was $6.68 compared to $2.69 for the same period last year.
- Non-GAAP diluted earnings per share was $6.59 this year compared to $4.97 last year.
When it reported second-quarter results on October 25, the company said it expected net sales to be in the range of $805.0 million to $825.0 million and non-GAAP EPS in the range of $5.10 to $5.25.
Brand Summary
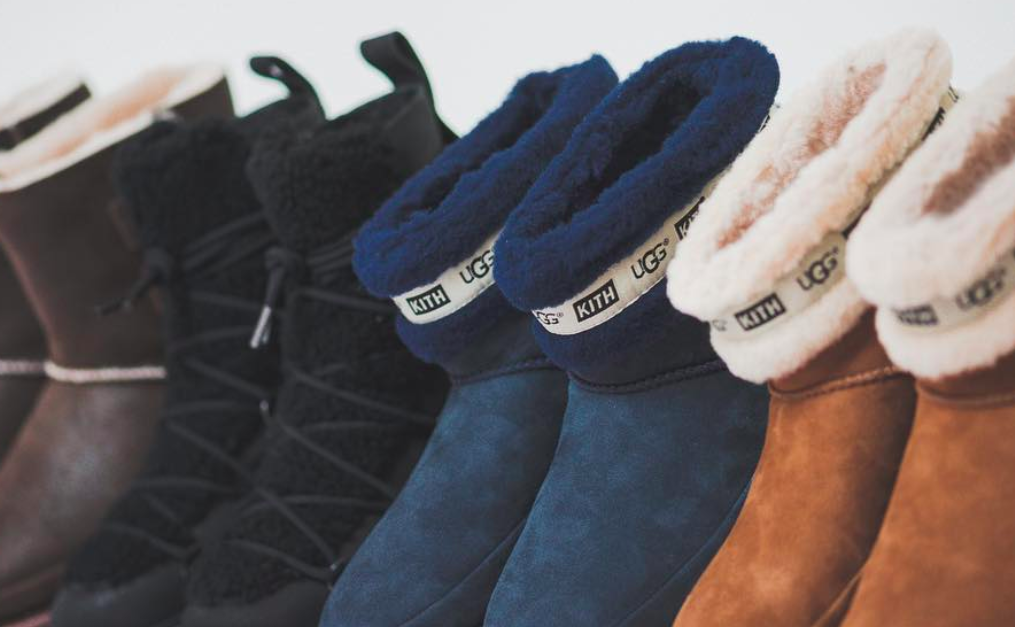
- Ugg brand net sales for the third quarter increased 3.6 percent to $761.0 million compared to $734.7 million for the same period last year.
- Hoka One One brand net sales for the third quarter increased 79.2 percent to $56.9 million compared to $31.8 million for the same period last year.
- Teva brand net sales for the third quarter increased 17.5 percent to $22.9 million compared to $19.5 million for the same period last year.
- Sanuk brand net sales for the third quarter decreased 7.0 percent to $12.9 million compared to $13.9 million for the same period last year.
Channel Summary (included in the brand sales numbers above)
- Wholesale net sales for the third quarter increased 12.5 percent to $482.2 million compared to $428.8 million for the same period last year.
- DTC net sales for the third quarter increased 2.6 percent to $391.6 million compared to $381.7 million for the same period last year. DTC comparable sales for the third quarter increased 1.4 percent over the same period last year.
Geographic Summary (included in the brand and channel sales numbers above)
- Domestic net sales for the third quarter increased 14.2 percent to $573.0 million compared to $501.7 million for the same period last year.
- International net sales for the third quarter decreased 2.6 percent to $300.8 million compared to $308.8 million for the same period last year.
Balance Sheet (December 31, 2018 as compared to December 31, 2017)
- Cash and cash equivalents were $515.9 million compared to $493.0 million.
- Inventories were $342.0 million compared to $396.3 million.
- Outstanding borrowings were $31.7 million compared to $32.2 million.
Stock Repurchase Program
During the third quarter, the company repurchased approximately 249 thousand shares of its common stock for a total of $27 million. As of December 31, 2018, the company had $89 million remaining under its $400 million in stock repurchase authorizations.
As of January 29, 2019, the Board of Directors approved an increase of $261 million to the company’s stock repurchase authorization. Combined with the previous outstanding amount of $89 million, this brings the company’s total stock repurchase authorization up to $350 million.
Full Year Fiscal 2019 Outlook for the Twelve Month Period Ending March 31, 2019
- Net sales are now expected to be in the range of $1.986 billion to $2.0 billion.
- Gross margin is now expected to be above 50.5 percent.
- SG&A expenses as a percentage of sales are now projected to be below 36.5 percent.
- Operating margin is now expected to be in the range of 14.5 percent to 14.7 percent.
- Effective tax rate is now expected to be approximately 20 percent.
- Non-GAAP diluted earnings per share are now expected to be in the range of $7.85 to $7.95.
- The earnings per share guidance excludes any charges that may occur from additional store closures, tax reform, organizational changes and other one-time or non-recurring amounts. It also does not assume any impact from additional share repurchases.
Previously, Deckers expected net sales in the range of $1.935 billion to $1.960 billion, gross margin to be approximately 50 percent, SG&A expenses as a percentage of sales are projected to be slightly better than 37 percent, operating margin in the range of 13.0 percent to 13.2 percent, an effective tax rate of approximately 21 percent and non-GAAP EPS in the range of $6.65 to $6.85.
Fourth Quarter Fiscal 2019 Outlook for the Three Month Period Ending March 31, 2019
- Net sales are expected to be in the range of $360.0 million to $374.0 million.
- Non-GAAP diluted earnings per share are expected to be in the range of break-even to $0.10.
- The earnings per share guidance excludes any charges that may occur from additional store closures, tax reform, organizational changes and other one-time or non-recurring amounts. It also does not assume any impact from additional share repurchases.
Image courtesy Ugg


