Newell Brands Inc. announced its fourth quarter and full year 2017 financial results.
Fourth Quarter 2017 Executive Summary
- Net sales were $3.7 billion, a 9.5 percent decline versus prior year, primarily reflecting the negative impact from divestitures, net of acquisitions; core sales declined 1.9 percent.
- Reported diluted earnings per share were $3.38 compared with $0.34 in the prior year, with the increase largely attributable to a one-time tax benefit as a result of the Tax Cuts and Jobs Act in the U.S. Pre-tax profit reflected cost synergies and contributions from acquisitions, offset by lost earnings from divested businesses, lower sales volume, unfavorable pricing and commodity cost inflation.
- Normalized diluted earnings per share were $0.68 compared with $0.80 in the prior year, as cost synergies, contributions from acquisitions and the benefits of a lower tax rate were offset by lost earnings from divested businesses, lower core sales volume, negative pricing, commodity cost inflation and a higher share count. Normalized diluted earnings per share is a non-GAAP measure that excludes certain items described below.
- Reported operating margin was 8.6 percent; normalized operating margin was 13.4 percent.
Operating cash flow was $990 million, compared with $992 million in the prior year, as the impact of lower earnings, largely due to divestitures, was offset by favorable working capital movement. - Grew global e-commerce sales by more than 25 percent. E-commerce represents 11 percent of net sales and has an accretive operating margin.
- Returned $264 million to shareholders in the form of dividends and share repurchases.
U.S. market share increased over 100 basis points in Writing, Home Fragrance, Baby, Outdoor & Recreation equipment, Food Storage, Fishing and Team Sports. - Strengthened the company’s balance sheet and improved financial flexibility, having paid down $1.4 billion in debt in 2017.
- Reaffirmed 2018 full year outlook for core sales growth, including the headwind from continued retailer inventory reductions and transitory customer disruptions in Baby and Writing; normalized earnings per share of $2.65 to $2.85; and operating cash flow of $1.15 billion to $1.45 billion. The company’s guidance for 2018 assumes continued ownership of all businesses for the entire calendar year.
“Our fourth quarter results were in-line with those we announced earlier. We had a particularly good outcome on cash flow but work to do on our other metrics,” said Michael Polk, Newell Brands chief executive officer. “The entire Board and management team recognize what needs to be done and we have taken decisive action to deliver the results and value our shareholders expect. In the fourth quarter, we generated approximately $1 billion of operating cash flow, strengthened our balance sheet and reduced debt. Over the course of 2017, we drove more than 25 percent e-commerce growth and increased market share across our portfolio–all while returning $581 million in capital to our shareholders. While strong retailer headwinds and increased inflation compromised our plans for margin development, our brand, design, innovation and e-commerce strategies are gaining momentum and delivering competitive results. In our first year together as a new organization, we have developed a set of winning capabilities designed to build leading brands and win in growing customers and channels. We are solidly positioned as we head into 2018 to deal with the continued retail landscape challenges ahead.”
Polk continued, “We are committed to building a leading consumer goods company that delivers strong results and significant value for our shareholders. Our accelerated transformation strategy is underway and will result in a simpler, faster and stronger Newell Brands with an $11 billion portfolio of leading consumer brands responsive to our advantaged capabilities in design, innovation, brand development and e-commerce. We expect our portfolio optimization work to generate approximately $6 billion in after tax proceeds, with roughly two-thirds of those proceeds to be used for debt reduction and one-third available for additional share repurchase. Accelerating our transformation, in combination with cash flow generation and margin improvement, will position us to win in the marketplace and deliver on the significant value creation opportunity inherent in Newell Brands.”
Acceleration of Transformation Plan Underway
On January 25, 2018, Newell Brands announced a series of strategic initiatives to accelerate the company’s transformation plan, improve operational performance and enhance shareholder value:
- Newell Brands will focus its portfolio on nine core consumer divisions with approximately $11 billion in net sales and $2 billion of EBITDA.
- The company will also explore strategic options for industrial and commercial product assets and certain smaller consumer businesses.
- Execution of these strategic options is expected to result in a significant reduction in operational complexity, including a 50 percent reduction in the company’s global factory and warehouse footprint, a 50 percent reduction in its customer base and the consolidation of 80% of global sales on two ERP platforms by the end of 2019.
Portfolio optimization efforts expected to generate approximately $6 billion in after tax proceeds, with roughly two-thirds of those proceeds to be used for debt reduction and the remaining one-third available for additional share repurchases.
Fourth Quarter 2017 Operating Results
Net sales declined 9.5 percent to $3.7 billion, reflecting the negative impact from divestitures, net of acquisitions. Core sales declined 1.9 percent.
Reported gross margin was 32.8 percent compared with 36.8 percent in the prior year, reflecting the mix effect of significantly lower Writing sales and the absence of the higher margin divested Tools business, unfavorable pricing, commodity and transportation cost inflation, reduced fixed cost absorption due to less production time on self-manufactured products related to significant improvement in inventory days on hand as compared with the prior quarter, and increased investment in e-commerce. These headwinds were partially offset by $33 million of synergies and cost savings in cost of goods sold. Normalized gross margin was 33.0 percent compared with 37.2 percent in the prior year.
Reported operating income was $323 million, or 8.6 percent of sales, compared with $513 million, or 12.4 percent of sales, in the prior year, reflecting the loss of approximately $70 million from divested businesses and increased investment in e-commerce, partially offset by synergies and cost savings of $75 million and the benefit of a lower management bonus accrual. Normalized operating income was $502 million compared with $676 million in the prior year. Normalized operating margin was 13.4 percent compared to 16.3 percent in the prior year.
The reported tax rate for the quarter was a benefit of 715.4 percent compared with a 57.7 percent rate in the prior year, primarily driven by U.S. tax reform-related benefits and expenses including the recognition of a $1.5 billion benefit related to the revaluation of the company’s deferred tax liability for the change in the U.S. tax rate from 35 percent to 21 percent, partially offset by a $195 million tax expense relating to the mandatory repatriation tax. The normalized tax rate was 12.0 percent, compared with 29.8 percent in the prior year. The year-over-year improvement reflects current year discrete benefits exceeding those in the prior year and the geographic mix effect of earnings.
The company reported net income of $1.7 billion compared with $166 million in the prior year, primarily attributable to the tax benefit. Reported diluted earnings per share were $3.38 compared with $0.34 in the prior year. Normalized net income was $335 million, or $0.68 per share, compared with $390 million, or $0.80 per share, in the prior year.
Operating cash flow was $990 million, reflecting favorable working capital movements primarily driven by significant improvement in inventory days on hand. Operating cash flow in the prior year was $992 million.
Fourth Quarter 2017 Operating Segment Results
The Live segment generated net sales of $1.72 billion, a 2.7 percent increase compared with $1.68 billion in the prior year. Core sales declined 1.8 percent, as growth in Home Fragrance and Fresh Preserving was offset by declines in Appliances and in Baby, which was impacted by inventory destocking at a leading baby retailer related to its reorganization proceedings. Reported operating income was $245 million compared with $305 million in the prior year. Reported operating margin was 14.2 percent of sales compared with 18.2 percent of sales in the prior year. The contraction is largely related to resin and transportation cost inflation related to hurricane disruption in the U.S., negative net pricing and lower fixed cost absorption related to manufacturing downtime taken in order to reduce finished goods inventories, partially offset by the benefit of a lower management bonus accrual. Normalized operating income was $271 million versus $328 million last year. Normalized operating margin was 15.7 percent of sales compared with 19.5 percent in the prior year.
The Learn segment generated net sales of $551 million, an 8.9 percent decline compared with $605 million in the prior year. Core sales declined 9.7 percent, with growth from Jostens offset by a double-digit decline in Writing related to retailer inventory destocking in the office superstore and distributive channels and a significant trade terms dispute with one of Writing’s large customers in the U.S. resulting in a period of stopped shipments. Lost sales associated with this customer accounted for the vast majority of the global Writing core sales decline versus prior year. Reported operating income was $50.7 million compared with $98.1 million in the prior year. Reported operating margin was 9.2 percent of sales compared with 16.2 percent in the prior year. Normalized operating income was $66.3 million compared with $117 million in the prior year. Normalized operating margin was 12.0 percent of sales compared with 19.4 percent last year, with the decline driven by the impact of lower sales volume, negative mix and lower fixed cost absorption related to manufacturing downtime taken in order to reduce finished goods inventories, partially offset by the benefit of a lower management bonus accrual.
The Work segment generated net sales of $705 million, a 3.0 percent decline compared with $727 million in the prior year. Core sales declined 1.2 percent, as continued strong growth from Waddington and Safety & Security was more than offset by softness in the Consumer and Commercial Solutions business. Reported operating income was $109 million compared with $113 million in the prior year. Reported operating margin was 15.5 percent of sales, unchanged compared with the prior year. Normalized operating income was $124 million versus $125 million last year. Normalized operating margin was 17.6 percent of sales compared with 17.1 percent last year, as the benefit of cost synergies, positive pricing, positive mix and a lower management bonus accrual more than offset resin and transportation cost inflation related to the hurricane disruption.
The Play segment generated net sales of $563 million, a 6.6 percent increase compared with $529 million in the prior year. Core sales grew 5.4 percent, reflecting strong growth on Coleman, Contigo, Marmot and Team Sports, partially offset by declines on Fishing. Reported operating income was $51.1 million compared with $37.6 million in the prior year. Reported operating margin was 9.1 percent of sales versus 7.1 percent in the prior year. Normalized operating income was $61.7 million versus $48.8 million in the prior year. Normalized operating margin was 11.0 percent of sales compared with 9.2 percent last year. The improvement is largely due to the benefit of positive mix, cost synergies and a lower management bonus accrual in 2018.
The Other segment generated net sales of $198 million, a decline of 66.7 percent compared with $596 million in the prior year, largely due to the divestitures of the Tools, Winter Sports, Fire Starter and Fire Log and Cordage businesses. Core sales declined 0.8 percent, as growth in the Process Solutions business was offset by weakness in Home & Family. Reported operating income was $27.4 million compared with operating income of $93.1 million in the prior year. Reported operating margin was 13.8 percent of sales, compared with 15.6 percent in the prior year. Normalized operating income was $40.7 million versus $111 million last year. Normalized operating margin was 20.5 percent of sales compared with 18.7 percent last year. The decrease in income relates largely to the lost earnings associated with divested businesses and the increase in normalized margin reflects improved product mix and the impact of cost synergies.
Full Year 2017 Results
Newell Brands completed the Jarden acquisition on April 15, 2016 and as a result the first quarter of 2016 and the first two weeks of April 2016 reflect the legacy Newell Rubbermaid results only.
Net sales for the full year ended December 31, 2017 were $14.7 billion, an increase of 11.1 percent compared with $13.3 billion in the prior year. Core sales increased 0.8 percent.
Reported gross margin was 34.5 percent, compared with 33.2 percent in the prior year. Normalized gross margin was 34.9 percent, compared with 37.0 percent in the prior year.
Full year 2017 reported operating income was $1.2 billion compared with $1.1 billion in the prior year. Reported operating margin was 8.3 percent, unchanged compared with the prior year. Normalized operating income was $2.09 billion compared with $2.06 billion in the prior year. Normalized operating margin was 14.2 percent compared with 15.6 percent in the prior year.
Reported net income was $2.7 billion compared with $528 million in the prior year. Reported diluted earnings per share were $5.63 compared with $1.25 in the prior year. Normalized net income was $1.3 billion compared to $1.2 billion in the prior year. Normalized diluted earnings per share were $2.75 compared with $2.89 in the prior year.
Operating cash flow was $932 million.
A reconciliation of reported results to normalized results is included in the appendix.
Outlook for the Twelve Months Ending December 31, 2018
For full year 2018, Newell Brands announced initial net sales guidance and reaffirmed its normalized EPS and operating cash flow guidance as follows:
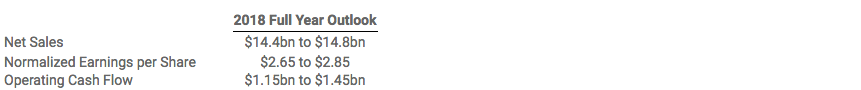
The company also reaffirmed that it expects to grow market share in its core categories and geographies in 2018, with core sales growth despite continued retailer inventory reductions.
The company’s 2018 guidance assumes continued ownership of all businesses for the entire calendar year. The company’s outlook assumes the successful Chapter 11 restructuring of its largest Baby customer, including recently published store closures and the resolution of its ongoing trade terms dispute with a top Writing customer, by the second quarter of 2018.
Core sales in 2018 will be calculated on a constant currency basis in line with industry practice. Core sales guidance excludes the impact of foreign currency, acquisitions until their first anniversary and completed divestitures.
Full year 2018 weighted average share count is projected at approximately 489 million shares and the full year 2018 tax rate is projected at 20 to 21 percent. The company excludes the amortization of intangible assets associated with acquisitions from its calculation of normalized earnings per share. Net sales guidance reflects new revenue recognition standards implemented January 1, 2018, resulting in a reduction in net sales of approximately $300 million with no earnings impact.
Newell Brands brands include Paper Mate®, Sharpie®, Dymo®, EXPO®, Parker®, Elmer’s®, Coleman®, Jostens®, Marmot®, Rawlings®, Oster®, Sunbeam®, FoodSaver®, Mr. Coffee®, Rubbermaid Commercial Products®, Graco®, Baby Jogger®, NUK®, Calphalon®, Rubbermaid®, Contigo®, First Alert®, Waddington and Yankee Candle.


