Iconix Brand Group reported second-quarter revenue excluding divested brands was down 7 percent, an improvement from the first quarter. But the company reduced its guidance for the year due to the timing of certain new initiatives, the transition of certain licensees and the deconsolidation of the Southeast Asia joint venture
John Haugh, CEO of Iconix, commented, “Today we are reporting second quarter revenue results that show an improvement from the first quarter. We entered the year with two primary goals, first to strengthen the balance sheet and enhance financial flexibility, and second to execute on our organic growth strategy. With the refinancing announced last week, we can report that our near-term balance sheet objectives are substantially complete. We know we need to deliver on both of our objectives. To that end, organic growth is taking longer than originally anticipated, but we are fully focused on our organic growth objectives and will have more to share with you in the coming weeks and months.”
In the course of finalizing the results for the second quarter of 2017, the company determined that its Southeast Asia joint venture should be deconsolidated. This deconsolidation was triggered by its joint venture partner’s payment of the final purchase price installment in respect of its interest in the Southeast Asia joint venture, which the company received in late June. Flowing such deconsolidation through the company’s financial statements is a time intensive process and as a result, the company is reporting today its preliminary results, excluding the effect of this deconsolidation, which will change as described herein. The company will file its 10-Q by August 14, 2017.
Preliminary Second Quarter 2017 Financial Results
Preliminary results for the second quarter ended June 30, 2017 do not reflect the non-cash gain that the company expects to record in the second quarter of 2017 related to the deconsolidation of its Southeast Asia joint venture. As such, among other items footnoted herein, the company’s GAAP operating income, GAAP net income and GAAP earnings per share for the second quarter of 2017 will be adjusted following the date hereof to reflect such gain. Such gain will be excluded from the company’s non-GAAP results.
Results for the second quarter ended June 30, 2017 reflect the entertainment segment as a discontinued operation. Unless otherwise noted, results presented in this press release are based on continuing operations.
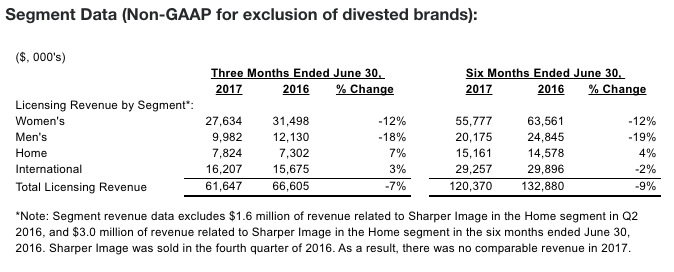
Licensing Revenue
For the second quarter of 2017, licensing revenue was $61.6 million, a 10 percent decline as compared to $68.2 million in the prior year quarter. Revenue in the prior year’s second quarter included approximately $1.6 million of licensing revenue from the Sharper Image brand which was sold in the fourth quarter of 2016. As a result, there was no comparable revenue in the second quarter of 2017. Excluding revenue from the Sharper Image brand, revenue declined approximately 7 percent in the second quarter of 2017.
SG&A Expenses
Total SG&A expenses in the second quarter of 2017 were $26.8 million, a 9 percent decrease as compared to approximately $29.5 million in the second quarter of 2016. The decline was primarily related to lower compensation expense and lower bad debt expense.
Special charges, which are included in SG&A and are related to professional fees associated with correspondence with the Staff of the SEC, the SEC investigation, the class action and derivative litigations, and costs related to the transition of Iconix management were approximately $2.5 million in the second quarter of 2017, as compared to $1.9 million in the prior year quarter. The company excludes special charges from its non-GAAP net income and non-GAAP EPS.
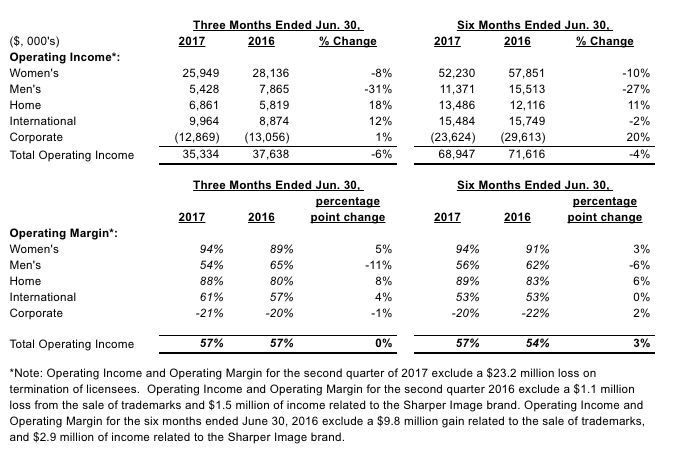
Operating Income
Operating Income in the second quarter of 2017 was $12.1 million, as compared to $38 million in the second quarter of 2016. Operating income in the second quarter of 2017, included a $23.2 million charge primarily related to licensee terminations associated with the transition of a new license. Operating income in the second quarter of 2016 included $1.5 million of income related to the Sharper image brand and a $1.1 million loss from the sale of trademarks. Excluding these items, operating income was approximately $35.3 million in the second quarter of 2017, a 6 percent decline from approximately $37.6 million in the second quarter of 2016.
Interest Expense
Interest expense in the second quarter of 2017 was $14.1 million, a 35 percent decline as compared to interest expense of $21.9 million in the second quarter of 2016. The company’s reported interest expense includes non-cash interest related to its outstanding convertible notes of $4.3 million in the second quarter of 2017 and $6.8 million in the second quarter of 2016. Excluding the non-cash interest related to the company’s outstanding convertible notes, interest expense was $9.8 million in the second quarter of 2017, as compared to $15.1 million in the second quarter of 2016. The lower interest expense is related to the company’s reduction of debt over the past year.
Other Income
In the second quarter of 2017, the company recognized a $13.9 million expense related to the early extinguishment of a portion of the company’s term loan, and in the second quarter of 2016 the company recognized a gain of $4.3 million primarily related to the repurchase of a portion of the company’s 2018 convertible notes at a discount. The company has excluded these items from its non-GAAP results.
GAAP Net Income And GAAP Diluted EPS
GAAP net income from continuing operations for the second quarter of 2017 was a loss of $16.3 million as compared to income of $10.6 million in the second quarter of 2016. The decline was primarily related to a licensee termination charge and a loss on the early extinguishment of debt. GAAP diluted EPS from continuing operations for the second quarter of 2017 was a loss of 30 cents as compared to diluted earnings per share of approximately 21 cents in the second quarter of 2016.
Non-GAAP Net Income and Non-GAAP Diluted EPS
Non-GAAP net income from continuing operations for the second quarter of 2017 was $15.2 million, an 18 percent increase as compared to $12.9 million in the second quarter of 2016.
Non-GAAP diluted EPS from continuing operations for the second quarter of 2017 was 26 cents as compared to 25 cents in the second quarter of 2016.
The cash benefit from the amortization of wholly-owned U.S. intangible assets for tax purposes was approximately 13 cents in the second quarter of 2017 as compared to 15 cents in the second quarter of 2016. Non-GAAP EPS adjusted for non-cash taxes related to the amortization of wholly-owned intangible assets amortizable for U.S. income tax purposes was approximately 39 cents in the second quarter of 2017 as compared to 40 cents in the second quarter of 2016.
Balance Sheet And Liquidity
The company ended the second quarter of 2017 with approximately $313 million of total cash and $980 million face value of debt. In the second quarter of 2017, the company paid down approximately $224 million of debt and, has subsequent to June 30, 2017 paid down an additional $167 million in the third quarter of 2017.
Prior to entering into a new $300 million term loan last week, of which the proceeds will be used to repay the $295 million of convertible notes due in March 2018 (with the remainder being used for general corporate purposes), the company’s total face value of debt was $814 million and the company had approximately $137 million of cash on its balance sheet.
Free Cash Flow
The company generated approximately $10.6 million of free cash flow from continuing operations in the second quarter of 2017, as compared to approximately $38.7 million in the second quarter of 2016. The decline is primarily related to the $23.2 million charge in the second quarter related to licensee terminations. Note that free cash flow in the second quarter 2017 excludes the effect of the deconsolidation of the Southeast Asia joint venture, which the company expects to have an immaterial impact to free cash flow.
2017 Guidance
The company is revising its 2017 guidance as follows.
The company expects full year 2017 revenue to be in a range of approximately $225 million to $235 million as compared to its previous guidance of $235 million to $245 million. The revision is related to the timing of certain new initiatives, the transition of certain licensees, and the deconsolidation of the Southeast Asia joint venture. The deconsolidation has no impact on 2017 second quarter revenue, but going forward revenue from the Southeast Asia joint venture will not be reflected in our topline revenue results. There was approximately $2.6 million of revenue from Southeast Asia in the second half of 2016, for which there will be no comparable revenue in 2017. Going forward, the net results for the Southeast Asia joint venture will be reported in the company’s equity earnings on joint ventures line on the income statement.
The company expects 2017 GAAP EPS to be a loss of (6 cents) to (1 cent) as compared to its previous guidance of 29 cents to 44 cents. This revision is primarily related to the charge from the termination licensees, the expense related to the early extinguishment of debt in the second quarter of 2017 and the revenue revision.
The company expects 2017 non-GAAP EPS to be in a range of 65 cents to 70 cents as compared to its previous guidance of 70 cents to 85 cents to reflect the revenue revision.
Non-GAAP EPS adjusted for wholly owned U.S. intangibles tax amortization: In 2017, the company expects to realize $29 million or 51 cents of earnings per diluted share of tax savings related to the amortization of the company’s wholly owned U.S. intangible assets. Adjusting for this tax benefit, the company expects non-GAAP EPS for 2017 to be in a range of $1.16 to $1.21 as compared to previous guidance of $1.21 to $1.36. This tax amortization is an ongoing benefit of the business model that the company believes is useful in evaluating the business.
The company expects full year 2017 free cash flow to be in a range of $65 million to $82 million, as compare to previous guidance of $105 million to $125 million. The revision is primarily related to the $23.3 million charge the company incurred in the second quarter as a result of terminating licensees, the downward revenue revision and a $10 million state tax audit settlement. Note that in June 2017 the company received $345 million of cash from the sale of the entertainment segment.
Iconix Brand Group owns: Candie’s, Bongo, Joe Boxer, Rampage, Mudd, Mossimo, London Fog, Ocean Pacific, Danskin, Rocawear, Cannon, Royal Velvet, Fieldcrest, Charisma, Starter, Waverly, Zoo York, Umbro, Lee Cooper, Ecko Unltd., Marc Ecko and Artful Dodger. In addition, Iconix owns interests in The Material Girl, Ed Hardy, Truth Or Dare, Modern Amusement, Buffalo, Nick Graham and Pony brands.
Photo courtesy Umbro


