Yue Yuen Industrial (Holdings) Ltd. reported earnings declined 40.3 percent in the year ended December 31 to $307.1 million. Revenues were down 6.3 percent to $9.7 billion.
For the year ended December 31, 2018, the Group recorded revenue of $9,695.3 million, representing an increase of 6.3 percent, compared with the previous year. Gross profit increased by 4.0 percent to $2,446.1 million, while the profit attributable to owners of the company declined by 40.9 percent to $307.1 million, as compared to $519.2 million recorded for the previous year. This was mainly due to operating deleverage within the manufacturing business, a reduction of the non-recurring gain for the year, as well as higher finance costs during the year. Basic earnings per share declined by 40.3 percent to 18.84 cents, compared with 31.55 cents for the previous year.
Recurring Profit Attributable to Owners of the company
Excluding all items of non-recurring nature, the recurring profit for the year ended December 31, 2018 declined by 35.0 percent to $325.7 million, compared to a recurring profit of $500.8 million for the previous year. For the year ended December 31, 2018, the Group recognized a non-recurring loss of $18.5 million, which included a loss of $23.4 million on financial instruments that was partly offset by one-off gains arising from the disposal of subsidiaries and associates. By contrast, for the year ended December 31, 2017, the Group recorded a non-recurring profit of $18.4 million, which included a fair value gain on derivative financial instruments and a one-off gain of $19.1 million on the disposal of subsidiaries and associates.
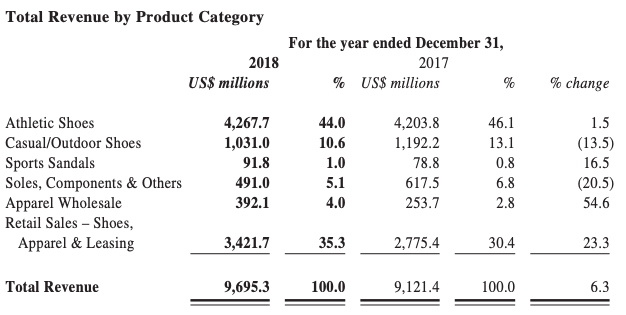
Total Revenue by Product Category
In the year ended December 31, 2018, revenue attributed to footwear manufacturing activity (including athletic shoes, casual/outdoor shoes and sports sandals) declined by 1.5 percent to $5,390.5 million, whereas the volume of shoes produced increased by 0.4 percent to 326.0 million pairs. The average selling price decreased by 2.0 percent to $16.53 per pair as compared with the previous year.
The Group’s athletic footwear category outperformed all other categories as a result of the global athleisure trend, accounting for 79.2 percent of footwear manufacturing revenue in 2018. Casual/outdoor shoes accounted for 19.1 percent of footwear manufacturing revenue. When considering the Group’s consolidated revenue, athletic shoes represented the Group’s principal category, accounting for 44.0 percent of total revenue in 2018, followed by casual/outdoor shoes, which accounted for 10.6 percent of total revenue. The Group’s revenue with respect to the manufacturing business (including footwear, as well as soles, components and others) was $5,881.5 million in 2018, a decrease of 3.5 percent as compared with the previous year.
The Group’s distribution sales are derived primarily from Pou Sheng, involving in retail operations for international sporting goods brands in the Greater China region. It also includes sales from Texas Clothing Holding Corp. (“TCHC”) Group, the Group’s apparel wholesale subsidiary in North America. Revenue attributable to the Group’s distribution business was $3,813.8 million in 2018, an increase of 25.9 percent as compared with the previous year.
In the year ended December 31, 2018, the revenue attributable to Pou Sheng grew by 23.3 percent to $3,421.7 million, compared to $2,775.4 million in the previous year. In RMB terms (Pou Sheng’s reporting currency), revenue increased by 20.4 percent to
RMB22,677.4 million in 2018, compared to RMB18,833.3 million in the previous year. As of December 31, 2018, Pou Sheng had 5,648 directly operated retail outlets and 3,551 stores operated by sub-distributors in the PRC.
Production Review
In 2018, the Group’s manufacturing business produced a total of 326.0 million pairs of shoes compared to 324.6 million pairs produced in the previous year. The average selling price per pair decreased 2.0 percent from $16.87 in 2017 to $16.53 in 2018. In terms of production allocation, Vietnam, Indonesia and the PRC continued to be the Group’s main production locations by volume in 2018, representing 46 percent, 37 percent and 14 percent of total shoe production, respectively, during the year under review
Cost Review
With respect to the cost of goods sold of the Group’s manufacturing business, the direct labor costs were $1,232.7 million (2017: $1,199.4 million); total main material costs were $2,215.4 million (2017: $2,339.6 million); and total production overheads were $1,284.4 million (2017: $1,275.5 million). The total cost of goods sold of the Group’s manufacturing business was $4,732.5 million for the period under review (2017: $4,814.5 million). For the Group’s distribution business, stock costs were $2,516.7 million (2017: $1,955.8 million).
The gross profit margin of the Group’s manufacturing business decreased by 1.5 percentage points to 19.5 percent in 2018 (2017: 21.0 percent) caused by fluctuating order patterns and unfavorable product mix due to changing consumer demand, which resulted in operating deleverage and negatively impacted the gross profit.
The gross profit margin for the Group excluding Pou Sheng (i.e. the manufacturing business and TCHC Group) during the year under review was 20.7 percent.
In 2018, Pou Sheng’s gross profit margin decreased from 35.0 percent in the previous year to 33.5 percent, which was mainly due to the change of channel mix, increased discounts and clearance sales for emerging brands.
The Group’s total selling and distribution expenses for 2018 amounted to $1,160.1 million (2017: $986.2 million), equivalent to approximately 12.0 percent (2017: 10.8 percent) of revenue. The increase in selling and distribution expenses was in proportion with the strong growth of the Group’s distribution business, which has a higher ratio of selling and distribution expenses to revenue compared to the manufacturing business. Administrative expenses for 2018 amounted to $658.3 million (2017: $635.8
million), equivalent to approximately 6.8 percent (2017: 7.0 percent) of revenue, remaining stable. With cost pressures remaining significant for both the manufacturing and distribution businesses, the management of both units will continuously look for ways to improve efficiency and productivity.
Product Development
In 2018, the Group spent $205.9 million (2017: $210.2 million) on product development, including investments in sampling, technological and digitalized development, as well as in production efficiency enhancements. For each of the major branded customers that have a research/development team, a parallel independent product development center exists within the Group to support the said research/development team. In addition to this product development work, the Group also cooperates with its customers to seek efficiency improvements in production processes, lead times and to formulate new techniques to produce high-quality footwear, as well as to incorporate innovative and environmental-friendly materials into the design, development and manufacture of footwear.
Liquidity and Financial Resources
The Group’s financial position remained solid. As at December 31, 2018, the Group had cash and cash equivalents of $851.4 million (2017: $1,036.8 million) and total bank borrowings of $2,123.9 million (2017: $1,963.3 million). The Group’s gearing ratio (total borrowings to total equity) was 46.7 percent (2017: 42.0 percent). As of December 31, 2018, the Group had net borrowing of $1,272.5 million (2017: $926.5 million). The increase in borrowing was mainly attributable to the Group’s efforts to improve its cost of capital while still keeping gearing at a comfortable level, as well as increased bank borrowings by Pou Sheng for working capital purposes.
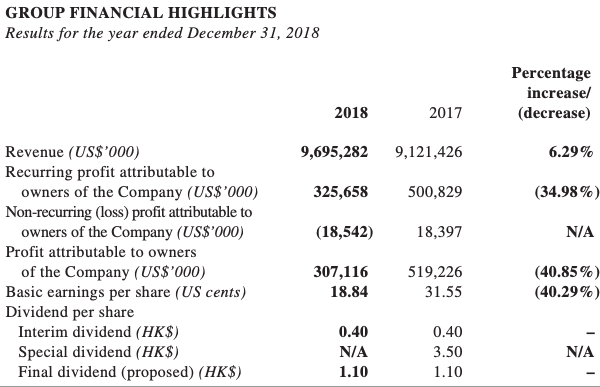
Image courtesy Yue Yuen


